
Watch These Amazon Stock Price Levels After Company Issues Soft Outlook

Key Takeaways
Amazon (
AMZN
) wavered between gains and losses Friday after the e-commerce and cloud computing giant
issued a cautious outlook
amid uncertainty about the economy, offsetting strong quarterly results.
During the company’s
earnings call
, CEO Andy Jassy told analysts the company hasn’t seen any significant impact from
tariffs
denting consumer demand or sellers setting product pricing, but cautioned that may change. He also said that Amazon has remained proactive to keep prices low.
Amazon shares had lost 13% since the start of the year through Thursday’s close and dropped 22% from their record high established in early February, weighed down by concerns that the company could get caught in the crosshairs of a protracted
U.S.- China trade war
. The stock was up about 1% at $192 in early-afternoon trading Friday, recovering from losses earlier in the session.
Below, we break down the
technicals
on Amazon’s chart and point out key post-earnings price levels worth monitoring.
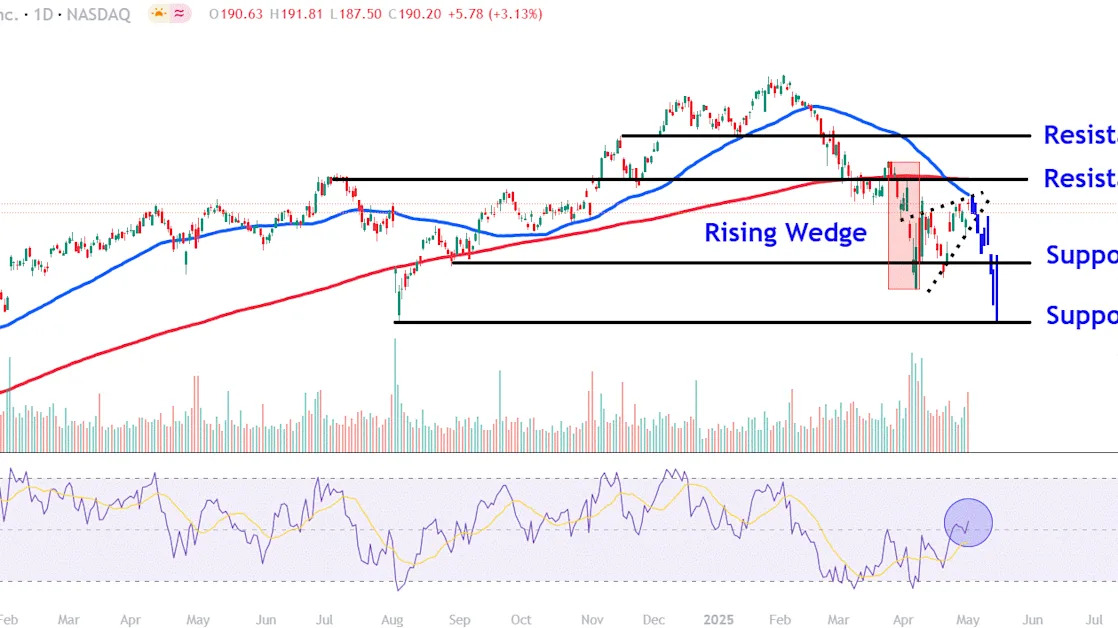
Rising Wedge in Focus
Since bottoming out last month, Amazon shares have consolidated within a
rising wedge
. More recently, the price has rallied toward the wedge’s top trendline and
50-day moving average (MA)
, a move that has coincided with the
relative strength index (RSI)
crossing back into bullish territory.
Let’s identify several key
support and resistance
levels on Amazon’s chart that will likely gain investors’ attention.
Key Support Levels to Monitor
A decisive
breakdown
below the rising wedge pattern’s lower trendline could see the shares drop to around $170. This area on the chart would likely provide support near the late-April low and the trough of a minor
pullback
to the 200-day MA last August.
Selling below this level brings lower support at $152 into play. Bargain hunters could seek buying opportunities at a location near last year’s early August
sell-off
low. This region also roughly aligns with a projected bars pattern downside target that extracts the trend lower that preceded the rising wedge and repositions it from the pattern’s top trendline, speculating where the shares may be headed if a continuation move lower plays out.
Important Resistance Levels to Watch
A breakout above the rising wedge pattern’s top trendline would likely see the stock test overhead resistance near $199. The shares may run into selling pressure in this area near a
horizontal line
that connects a range of corresponding trading activity on the chart extending back to early July last year.
Finally, a more
bullish
move higher in Amazon shares could propel a move up to $216. Investors who bought at lower levels may see this as high probability area to place sell orders near the stock’s November
peak
and January trough.
The comments, opinions, and analyses expressed on Investopedia are for informational purposes only. Read our
warranty and liability disclaimer
for more info.
As of the date this article was written, the author does not own any of the above securities.
Read the original article on
Investopedia
