
Watch These AMD Price Levels as Stock Jumps After AI-Related Acquisition
Shares Jumped More Than 4% on Monday

Key Takeaways
Advanced Micro Devices (
AMD
) jumped more than 4% Monday on news that the chipmaker had beefed up its
artificial intelligence (AI)
portfolio with a
$4.9 billion cash and stock purchase
of data center infrastructure provider ZT systems.
Since reaching their record closing high in early March, AMD shares have lost about a quarter of their value, in part over concerns that the chipmaker wasn’t capitalizing on the booming AI chip market, currently dominated by rival Nvidia (
NVDA
).
Below, we take a closer look at AMD’s chart and use
technical analysis
to zone in on important price levels investors will likely be watching.
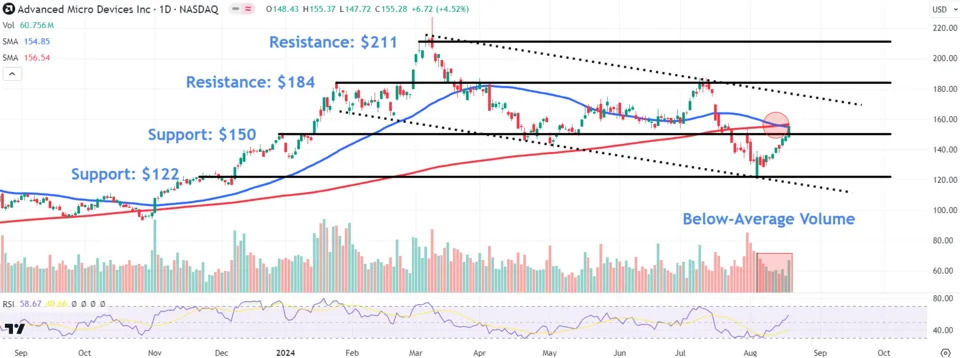
Stock Trades Within Descending Channel
AMD shares have oscillated within a
descending channel
since a
bearish engulfing pattern
marked the stock’s record high in early March. More recently, the price has trended higher after finding buying interest around the channel’s lower trendline, though
trading volumes
have remained below-average throughout the majority of the move, indicating a lack of conviction by larger market participants.
It’s also worth pointing out that the 50-day moving average (MA) crossed below the 200-day MA last week to form an ominous
death cross
, a chart pattern that predicts lower prices.
Looking ahead, investors should monitor several key
support and resistance
price levels on AMD’s chart that may come into focus.
Support Levels to Monitor
An initial support area to watch sits around $150, just 3% below Monday’s closing price. This area may attract buyers seeking
entry points
near a trendline connecting several
peaks and troughs
between December and July.
A deeper
retracement
could see shares fall to the $122 area, a location on the chart where investors may look for buying opportunities near the November high, which also closely aligns with this month’s low.
Resistance Areas to Watch
Ongoing buying could drive a rally up to the $184 region just above the channel’s upper trendline, where the price would likely run into overhead resistance near a
horizontal line
linking a range of comparable trading levels between January and April with the prominent July
swing high
.
A more bullish move could see the stock climb to around $211, an area on the chart where sellers may look to
lock in profits
near a range of similar prices just below the record high.
AMD shares gained 4.5% Monday to close at $155.28.
The comments, opinions, and analyses expressed on Investopedia are for informational purposes only. Read our
warranty and liability disclaimer
for more info.
As of the date this article was written, the author does not own any of the above securities.
Read the original article on
Investopedia
.
