
Watch These AMD Stock Price Levels Following Earnings-Driven Surge

Key Takeaways
Advance Micro Devices (
AMD
) shares surged more than 9% in premarket trading Wednesday after the chipmaker posted better-than-expected
second quarter revenue
and issued an upbeat sales outlook for the second half, boosted by robust growth in its data center segment driven by
artificial intelligence (AI)
demand.
The post-earnings pop follows a period of heightened
volatility
in the stock, which has fallen around 35% from its March 7 record close. The recent downturn stemmed from concerns about the company’s ability to capture a greater share of the booming AI silicon market and recent
broad-based selling across the chip sector
amid worries over tightening export curbs with China.
Below, we take a detailed look at AMD’s chart and use
technical analysis
to identify key price levels of interest to investors.
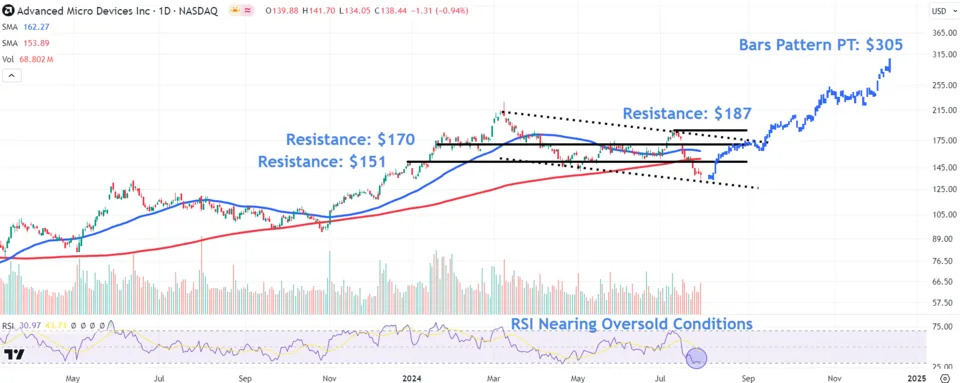
Nearing Oversold Conditions
Since setting a
record high
in early March AMD shares have oscillated within a
descending channel
, a chart pattern that indicates a downward trend in prices.
Following a rally to the channel’s upper trendline earlier this month, the price has fallen around 25% to trade below both the 50- and 200-day
moving averages
leading into the chipmaker’s quarterly results.
However,
volumes
have remained below average throughout the recent sell-off, while the
relative strength index (RSI)
indicator nears oversold levels, setting the stock up for a post-earnings bounce.
Key Resistance Levels Amid Earnings Surge
If bulls regain control of the action post earnings, investors should eye three important price levels where AMD shares could run into overhead
resistance
.
The first sits around $151, a level on the chart where short-term traders could
lock in profits
near a
trendline
connecting a series of comparable price action between January and July, currently sitting just below the rising 200-day moving average.
A
breakout
above this area may fuel a move to $170, where the shares may encounter resistance near two periods of narrow
consolidation
throughout most of February and in the second half of May.
Further buying could see a retest of the $187 level, where the stock would likely run into selling pressure near the July
swing high
, positioned just above the descending channel’s upper trendline and January peak.
Longer-Term Bullish Target
To forecast a longer-term upside target, investors can use a bars pattern. To do this, we take AMD’s
trending
move from late October to the March high and position it from Tuesday’s low, which predicts a target of around $305.
AMD shares were up 8.9% at $150.81 in premarket trading about two-and-a-half hours before Wednesday’s opening bell.
The comments, opinions, and analyses expressed on Investopedia are for informational purposes only. Read our
warranty and liability disclaimer
for more info.
As of the date this article was written, the author does not own any of the above securities.
Read the original article on
Investopedia
.
