
Watch These Berkshire Hathaway Stock Price Levels After Warren Buffett Announces Retirement

Key Takeaways
Berkshire Hathaway (
BRK.B
) shares will be on investors’ radar screen after legendary investor Warren Buffett said on Saturday at the
conglomerate’s annual meeting
that he
plans to step down as CEO at the end of this year
.
The 94-year-old Buffett, who has headed the company for 60 years, said he will hand over the reins to Vice Chairman Greg Abel, who has long been identified by Berkshire as Buffett’s successor. Buffett’s retirement marks the end of an era that has cemented his place as an investment icon and American success story after
transforming a faltering textile company into a trillion dollar conglomerate
with successful businesses across many sectors.
Berkshire shares climbed to a fresh record high on Friday before Buffett’s announcement on Saturday. As of last week’s close, the stock has gained 19% since the start of the year and trades 35% higher over the past 12 months. By comparison, the benchmark
S&P 500
has lost 3% and added 11%, respectively, over the same periods.
Below, we take a closer look at the
technicals
on Berkshire’s chart and identify key price levels investors will likely be watching.
Ascending Triangle Breakout
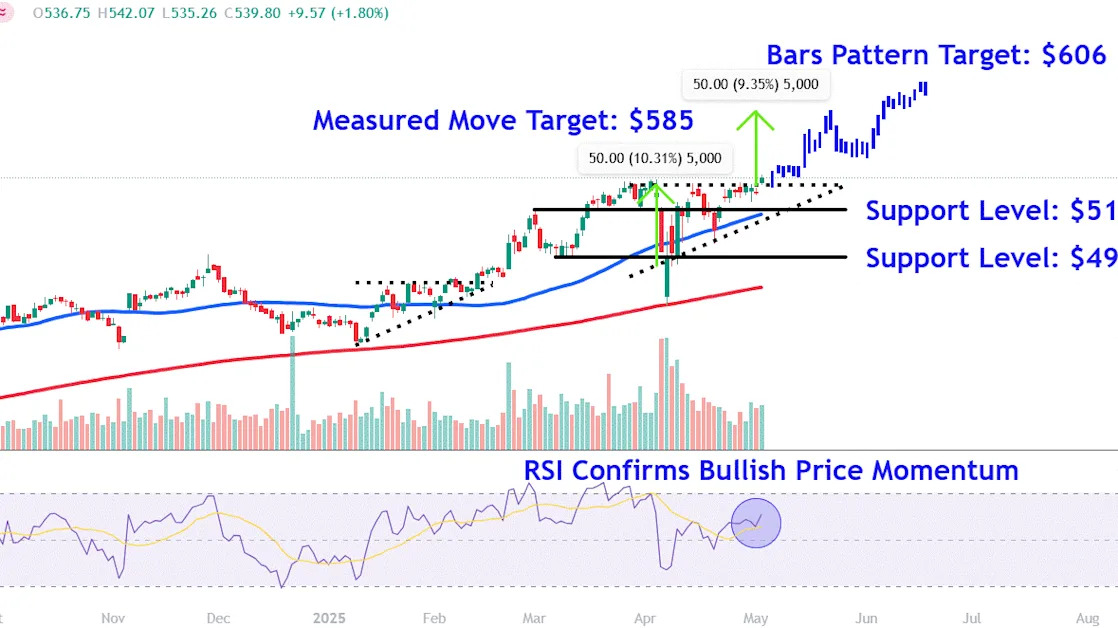
Berkshire shares broke out above the upper trendline of an
ascending triangle
in Friday’s trading session, potentially setting the stage for a
continuation
move higher.
Meanwhile, the
relative strength index (RSI)
confirms bullish price momentum with a reading above the 50 threshold, though the indicator sits below
overbought
levels, providing ample room for the stock to trend higher.
Let’s apply several
technical analysis
techniques to Berkshire’s chart helping us identify key overhead areas worth watching, while also locating two crucial
support levels
that could come into play during future
pullbacks
.
Key Overhead Areas to Watch
Measured Move Target
To project an upside target using the measured move technique, we calculate the distance between the ascending triangle’s two trendlines near the start of the pattern and add that amount to Friday’s
breakout
point. Therefore, we add $50 to $535, which forecasts a target of $585, about 8% above Friday’s closing price.
Bars Pattern Target
Investors can also use the bars pattern tool to project a
bullish
target. When applying the technique to Berkshire’s chart, we extract the price bars comprising the stock’s trend higher from early February to late March and reposition them from Friday’s breakout point.
This projects a target of around $606, around 12% above of Friday’s close. We selected this prior move higher as it followed a breakout from an earlier ascending triangle on the chart, providing insight into how a similar uptrend may play out if
price action
rhymes.
Crucial Support Levels to Monitor
A close below the ascending triangle’s top trendline could trigger an initial pullback in the stock to around $519. This area on the chart may provide support near the prominent early-March
peak
and a period of trading activity that formed within the pattern.
Finally, a more significant
retracement
could see Berkshire shares revisit lower support at $490. Investors may seek entry points in this region near the notable early-March
swing low
during a dip toward the
50-day moving average
.
The comments, opinions, and analyses expressed on Investopedia are for informational purposes only. Read our
warranty and liability disclaimer
for more info.
As of the date this article was written, the author does not own any of the above securities.
Read the original article on
Investopedia
