
Watch These Coinbase Price Levels After Stock’s 20% Drop in March

Key Takeaways
Coinbase (
COIN
) shares lost ground for a fourth-consecutive session on Monday, wrapping up a volatile month in which the stock lost one-fifth of its value.
Shares of the largest U.S.-based
crypto brokerage
have fallen sharply since registering a three-year high in early December. The decline closely correlates with a steep fall in
trading volumes
on the exchange since that time amid a significant retracement in bitcoin’s price, prompting concerns that lower transaction fees could crimp the company’s
revenue
.
Coinbase shares have lost about half their value from their December peak, tracking a broad
sell-off
in leading cryptocurrencies and technology stocks over
worries that tariffs could slow economic growth
and reignite
inflation
. The stock fell 1% to close Monday’s session at $172.23.
Below, we break down the
technicals
on the Coinbase chart and point out major price levels worth watching out for.
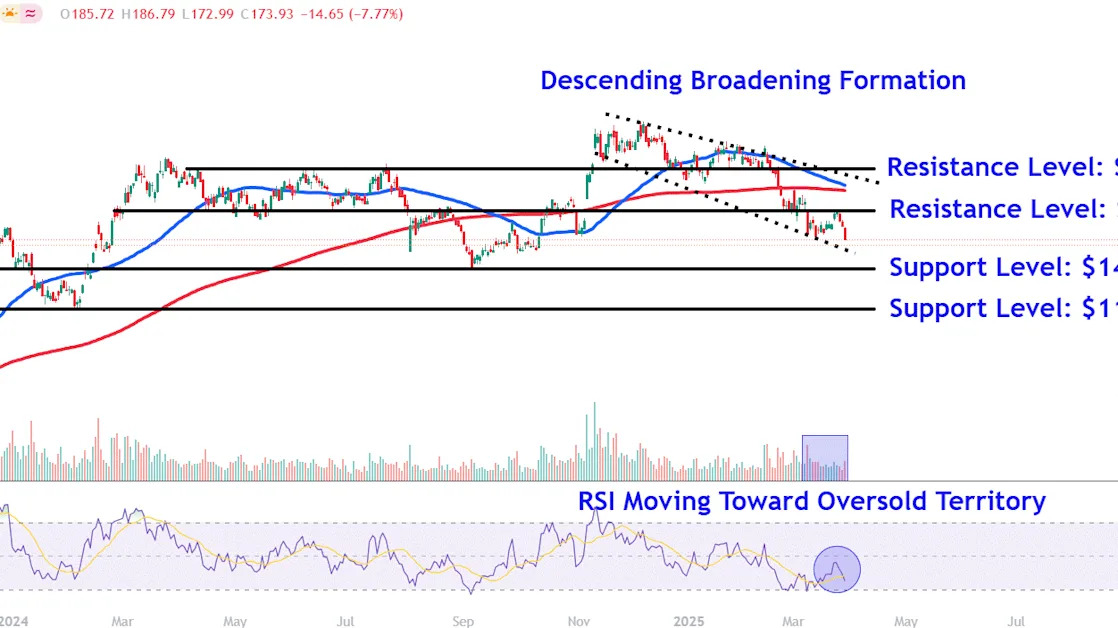
Descending Broadening Formation
Coinbase shares have retreated within a
descending broadening formation
since last November, with the
50-day moving average (MA)
poised to cross below the 200-day MA to form an ominous
death cross
, a chart pattern that signals lower prices.
More recently, the stock has fallen toward the formation’s lower trendline, though
volume
generally declined throughout most of March, indicating a waning trading interest in the shares.
Meanwhile, the
relative strength index (RSI)
nears
oversold
territory, cautioning investors of weakening price momentum.
Let’s locate major
support and resistance
levels of interest on the Coinbase chart that investors me be watching.
Major Support Levels of Interest
A decisive
breakdown
below the descending broadening formation’s lower trendline could see the shares initially revisit lower support around $146. Investors may look for buying opportunities in this area near last year’s prominent September
swing low
, a location also aligning with a series of comparable trading levels on the chart between December 2023 and February 2024.
Selling below this level could see the shares drop to the $115 level. This area on the chart would likely provide support near a multi-month
horizontal line
that links the July 2023 peak and February 2024 trough.
Key Resistance Levels to Watch
Initial upswings in the stock could run into selling pressure around $206. Coinbase shares may encounter resistance in this location near the March
countertrend
peak, which aligns with a range of
price action
on the chart extending back to last February.
Finally, a
rally
above this area brings the $264 level into play. This region, currently positioned just above the descending broadening formation’s upper trendline, would likely attract interest near a range of
peaks and troughs
that formed on the chart between April last year and February this year.
The comments, opinions, and analyses expressed on Investopedia are for informational purposes only. Read our
warranty and liability disclaimer
for more info.
As of the date this article was written, the author does not own any of the above securities.
Read the original article on
Investopedia
