
Watch These Coinbase Price Levels as Stock Rallies to Start 2025

Key Takeaways
Coinbase (
COIN
) shares are off to a strong start this year following a recent
retracement
.
Since
Donald Trump’s election win
in early November, the stock has gained more than 30% amid optimism that his administration and a crypto-friendly Republican Congress will position the United States as a global cryptocurrency leader, creating a more favorable regulatory environment for exchanges like Coinbase.
Looking
ahead
, the company also sits well positioned to benefit for increased trading activity, with Bitcoin (
BTCUSD
) still hovering just below the $100K level and other large-cap
altcoins
, such as Ethereum (
ETHUSD
) and Solana (
SOLUSD
), performing strongly since the election.
Coinbase shares were up 2% at around $263 in early trading Friday, after gaining more than 3% yesterday.
Below, we take a closer look at the Coinbase chart and apply
technical analysis
to identify important price levels worth watching out for.
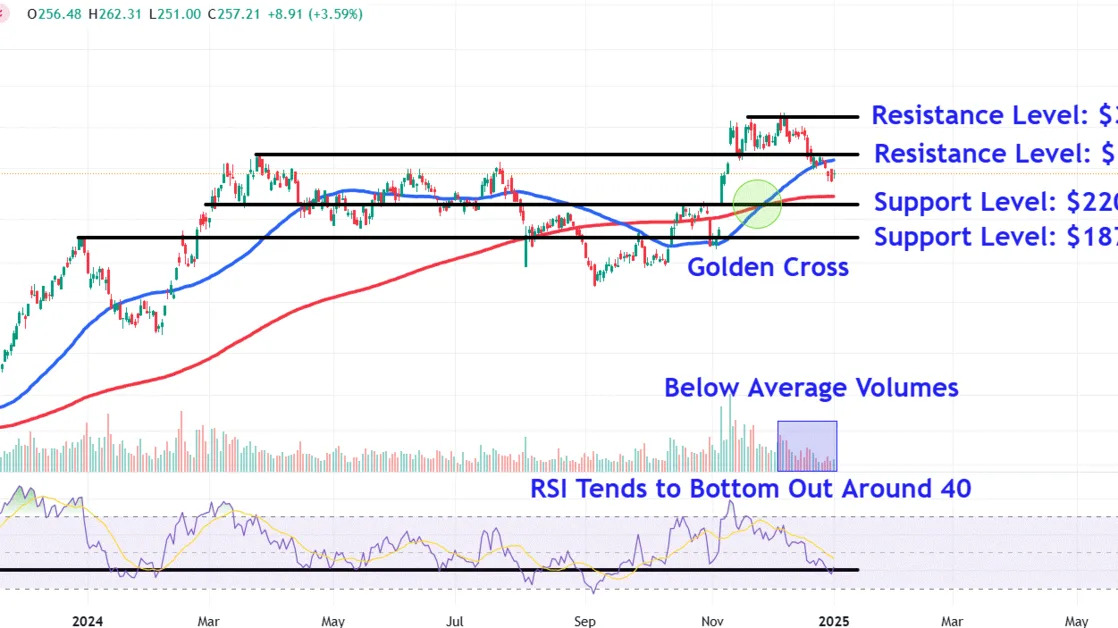
Retracement After Setting 3-Year High
Coinbase shares set a new three-year high in early December, shortly after the 50-day moving average (MA) crossed above the
200-day MA
to form a bullish
golden cross
signal. However, since that time, the stock has retraced about half of its post-election rally, with the price sitting roughly midway between the 200- and 50-day MAs.
While the
relative strength index (RSI)
confirms weak price momentum with a reading around 40, the stock has shown a historical tendency to bounce when the indicator falls to this level. Moreover, below-average
volumes
have accompanied the recent move lower, indicating a lack of selling conviction.
Let’s identify important
support and resistance
levels on the Coinbase chart that investors may be eyeing early in the first quarter.
Key Support Levels to Watch
The first support level to watch sits around $220, just below the 200-day MA. Investors may look for
entry points
in this area near a trendline that connects multiple
peaks and troughs
on the chart between March and October.
The
bulls’
inability to defend this level could see the shares decline to around $187, This location on the chart may attract support near the prominent December 2023
swing high
, which also closely aligns with a range of similar price points from February to November last year.
Important Resistance Levels to Track
If the shares move higher this month, investors should initially monitor the $283 level, a region on the chart where they could encounter selling pressure near the March peak, the mid-November retracement low, and the nearby 50-day MA.
A decisive close above this level could see a move to around $342. Traders who purchased shares during the recent
pullback
may look to
lock in profits
in this location near a range of
consolidation
positioned just below the stock’s December high.
The comments, opinions, and analyses expressed on Investopedia are for informational purposes only. Read our
warranty and liability disclaimer
for more info.
As of the date this article was written, the author does not own any of the above securities.
Read the original article on
Investopedia
