
Watch These D-Wave Quantum Price Levels After Stock Surges to Highest Level Since 2022

Key Takeaways
D-Wave Quantum (
QBTS
) shares may remain on watchlists Tuesday after surging to a multi-year high today as investors continued to pile into the stock following
news last week that the company’s quantum computer outperformed a supercomputer
.
D-Wave said in a
press release last Wednesday
that its annealing quantum computer outperformed one of the world’s most powerful classical supercomputers in solving complex materials discovery problems. CEO Alan Bratz said that the company’s
quantum computer
can now exceed the performance of the most powerful supercomputers.
Since last week’s announcement, D-Wave shares have nearly doubled. The stock has soared more than 400% over the past 12 months amid growing interest in the quantum computing sector.
D-Wave shares gained 10% on Monday, closing at $11.18, their highest level since August 2022.
Below, we take a closer look at the
technicals
on D-Wave’s chart and identify important price levels that investors may be watching.
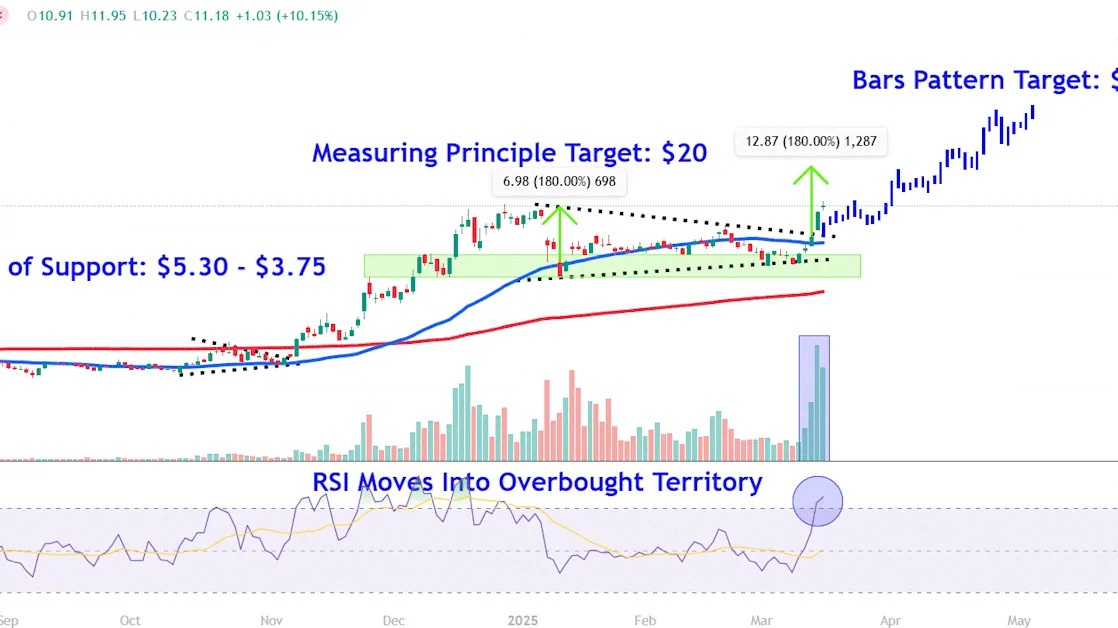
Symmetrical Triangle Breakout
D-Wave shares consolidated within a
symmetrical triangle
for several months before breaking out above the pattern’s upper trendline in Friday’s trading session, setting the stage for a
continuation
of the stock’s move higher.
Importantly, increasing
volume
has backed the move higher, indicating strong buying conviction behind the breakout. Moreover, the
relative strength index (RSI)
confirms bullish price momentum, though the indicator has moved into
overbought
territory, raising the possibility of short-term profit-taking.
Let’s apply
technical analysis
to project two potential bullish targets to watch on D-Wave’s chart and also point out an important
zone of support
worth monitoring during retracements.
Chart-Based Bullish Price Targets
Measuring Principle Target
When using the
measuring principle
to forecast a target, we calculate the percentage change of the symmetrical triangle near the start of the pattern and add it to the breakout point. For example, we apply a 180% increase to $7.15, which projects a bullish target of $20.
Bars Pattern Target
Forecasting a target using bars pattern analysis works by extracting the stock’s
trend
from early November to late December last year and repositioning it from Friday’s breakout point. This analysis projects a bullish target of around $52, an area where the shares may be headed if
price action
mimics the prior move higher.
Interestingly, the earlier
uptrend
analyzed followed a
breakout
from a symmetrical triangle, similar to how the current move higher has started.
Important Zone of Support Worth Monitoring
During profit-taking periods in D-Wave shares, it’s worth keeping a close eye on a zone of support between $5.30 and $3.75. Investors may look for buying opportunities in this area near a range of
peaks and troughs
that formed on the chart between November last year and March this year.
The comments, opinions, and analyses expressed on Investopedia are for informational purposes only. Read our
warranty and liability disclaimer
for more info.
As of the date this article was written, the author does not own any of the above securities.
Read the original article on
Investopedia
