
Watch These GameStop Price Levels as Stock Has Bucked Broader Sell-Off

Key Takeaways
GameStop (
GME
) shares rose again today after surging 11% on Friday, as the stock has largely avoided the
broader sell-off in equities
fueled by concerns about tariffs.
Shares in the video game retailer and
meme stock
surged to close out last week on
news that CEO Ryan Cohen increased his stake in the company
, with a regulatory filing revealing he purchased 500,000 shares, taking his total stake to more than 37 million shares, or roughly 8.4% of GameStop’s
outstanding shares
.
Through Monday’s close, GameStop shares have lost about 23% of their value since the start of the year. The stock had rallied to a two-month high in late March after the retailer announced it had
added bitcoin to its corporate investment policy
, before paring gains.
Below, we take a closer look at GameStop’s chart and use
technical analysis
to point out crucial levels worth watching amid the potential for further sudden price swings.
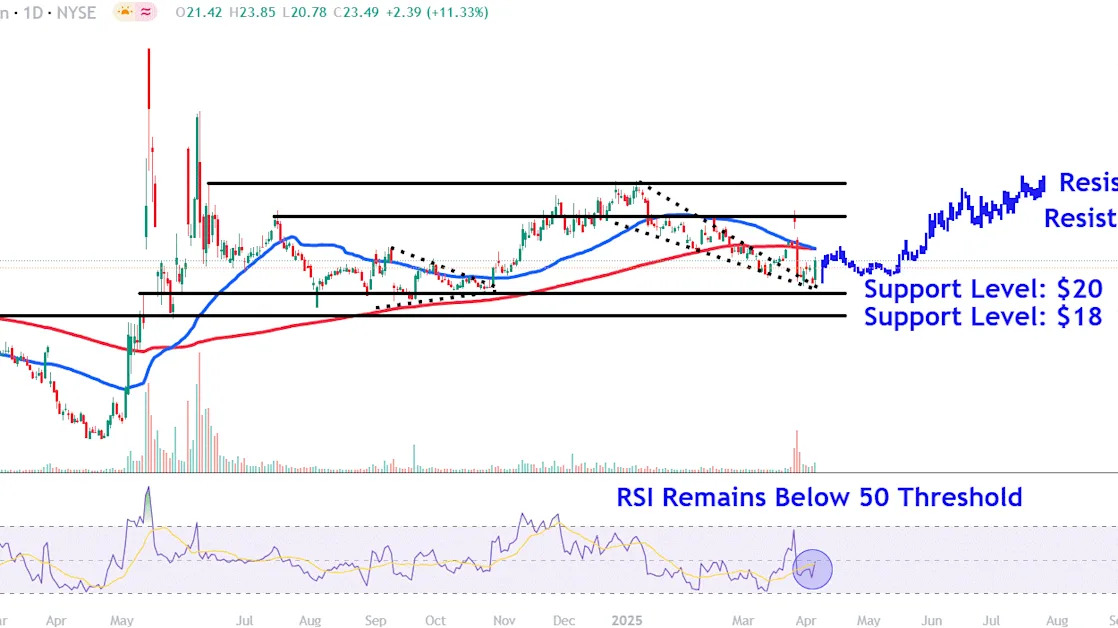
Falling Wedge Retrace
After breaking out above a
falling wedge
pattern last month, GameStop shares rallied sharply before completely retracing the move.
More recently however, the stock found buying interest near the falling wedge pattern’s top trendline, completing a
bullish engulfing pattern
in Friday’s trading session. However, a looming
death cross
on the stock’s chart sends conflicting technical signals.
Meanwhile, Friday’s unexpected rally coincided with the
relative strength index (RSI)
turning higher, though the indicator remains below the 50 threshold, signaling lackluster price momentum.
Let’s identify crucial
support and resistance
levels on GameStop’s chart that investors may be monitoring.
Crucial Support Levels Worth Watching
The stock rose 3.4% on Monday to close at $24.29.
In terms of support, it’s worth watching the $20 level. This area on the chart, just beneath the April low, could attract buying interest near a trendline that connects the top of a
shooting star
pattern last May with prominent
troughs
that formed on the chart in August and September.
Selling below this level could see the shares retrace to around $18. Investors may seek
entry points
in this region near a range of corresponding trading activity on the chart between November 2023 and May last year.
Key Resistance Levels to Monitor
A move higher from current levels could initially propel a rally to the $29 level. The shares would likely encounter resistance in this area near last month’s high, which also lines up with last year’s notable July
peak
.
Finally, buying above this level opens the door for a retest of higher resistance around $34. Investors who have bought GameStop shares at lower prices may decide to
lock in profits
in this location near the January peak and the high of a significant intraday
reversal
that formed on the chart last June.
This area also roughly sits in the same region as a projected bars pattern
price target
that takes the stock’s
trend
higher from October to January and overlays it from Friday’s breakout point. Interestingly, the prior uptrend analyzed followed a
symmetrical triangle
, potentially providing clues as to how a future move higher from the current falling wedge may play out.
The comments, opinions, and analyses expressed on Investopedia are for informational purposes only. Read our
warranty and liability disclaimer
for more info.
As of the date this article was written, the author does not own any of the above securities.
Read the original article on
Investopedia
