
Watch These GameStop Stock Price Levels As Video Game Retailer’s Earnings on Deck

Key Takeaways
GameStop (
GME
) shares gained ground to start the week ahead of the scheduled release of the video game retailer’s earnings report after Tuesday’s closing bell.
Analysts expect the company to post fourth-quarter earnings of 9 cents per share on revenue of $1.48 billion, though investors will likely be more focused on updates about the retailer’s investment strategy, specifically in relation to digital currencies.
Last month, GameStop Chairman and CEO Ryan Cohen acknowledged that he received a proposal from Strive Asset Management to convert the company’s nearly $5 billion cash reserve into bitcoin but has not yet said if the retailer will consider the idea.
Earlier in February, reports surfaced that the company was considering investing in alternative investments, including bitcoin and other cryptocurrencies, after
Cohen posted a photo of himself with Michael Saylor
, co-founder of Strategy (
MSTR
), formally known as MicroStrategy, the largest corporate holder of bitcoin.
GameStop shares, which also double as a
meme stock
favorite among retail traders, rose 3.5% to $25.61 on Monday, adding to last week’s 7% gain, indicating speculative buying ahead of the company’s quarterly results. The stock is still down 18% since the start of the year.
Below, we take a closer look at GameStop’s chart and use
technical analysis
to identify key levels worth watching amid the potential for significant earnings-driven price swings.
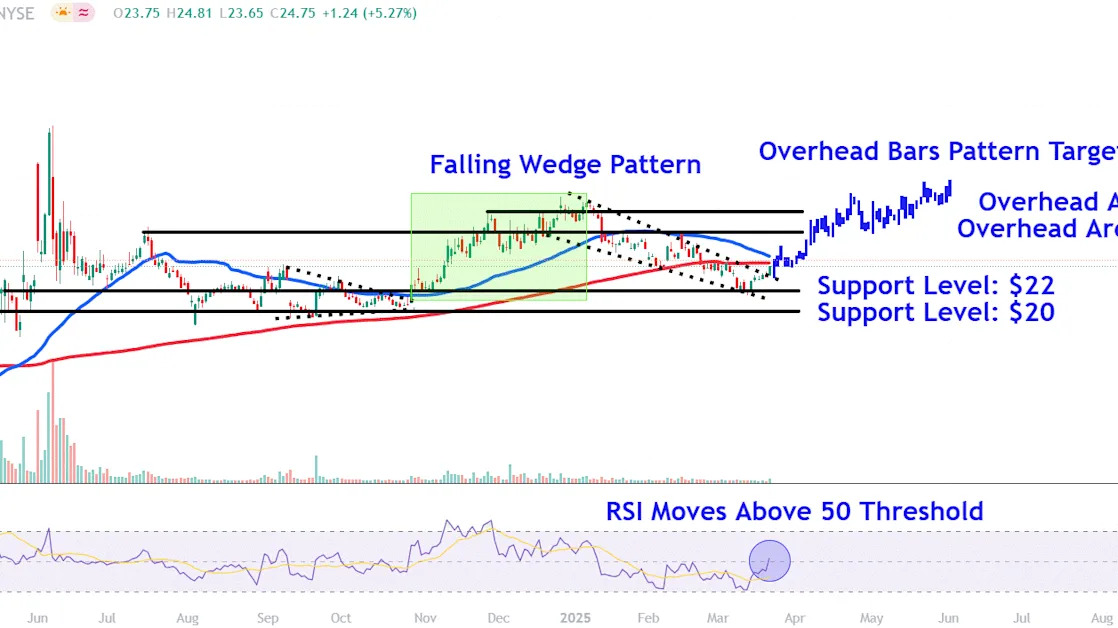
Falling Wedge Breakout
GameStop shares broke out above the top trendline of a three-month
falling wedge
pattern on above-average
volume
in Friday’s trading session, possibly paving the way for an earnings-fueled rally. Moreover, the
relative strength index (RSI)
crossed back above the 50 threshold late last week, indicating improving price momentum.
However, in a conflicting technical signal, the
50-day moving average (MA)
sits on the precipice of crossing below the 200-day MA to form an ominous
death cross
, a chart pattern that predicts lower prices.
Let’s point out three key overhead areas that could come into play if GameStop shares move higher and also identify several important
support levels
worth eyeing during potential retracements.
Key Overhead Areas to Watch
Firstly, it’s worth keeping an eye on the $29 area. This region could provide overhead
resistance
near a trendline that connects last year’s July
swing high
with a series of corresponding price points on the chart between November and February.
A bullish move above this area could see the shares climb to around $32. Tactical traders may seek
profit-taking
opportunities at this level near the November and December
peaks
.
To project a
price target
above this year’s high, investors can use the bars pattern tool. When applying the analysis to GameStop’s chart, we take the bars comprising the stock’s
trend
higher from October to January and reposition them from Friday’s breakout point. This forecasts a target in the neighborhood of $37.
Important Support Levels Worth Eyeing
A failed
breakout
could see the shares retrace to around $22. This area on the chart may provide support near the February low, which sits on a
horizontal line
that stretches back to May last year.
Finally, selling below this level opens the door for a retest of lower support at the
psychological
$20 level. Investors could seek
entry points
in this location near a range of troughs that formed on the chart between August and October and the area that preceded last May’s meme-driven
break-away gap
.
The comments, opinions, and analyses expressed on Investopedia are for informational purposes only. Read our
warranty and liability disclaimer
for more info.
As of the date this article was written, the author does not own any of the above securities.
Read the original article on
Investopedia
