

Watch These HP Enterprise Price Levels as Stock Drops After Earnings
Key Takeaways
Hewlett Packard Enterprise (
HPE
) shares fell in premarket trading Thursday, even as the storage and server maker’s fiscal third-quarter earnings
topped analysts’ estimates
. The company, while lifting its annual profit guidance, left its full-year
revenue
forecast unchanged, possibly disappointing investors amid lofty expectations for
artificial intelligence (AI)
-fueled sales growth.
The enterprise technology giant’s stock has gained about 10% since the start of the year through Wednesday’s close, benefiting from strong growth in its AI server business as companies ramp up spending on infrastructure to run
generative AI
and
machine learning
applications.
Below, we take a closer look at the
technicals
on the HP Enterprise weekly chart and point out important post-earnings price levels to watch out for. The stock was down 3.3% at $18.15 about two hours before Thursday’s opening bell.
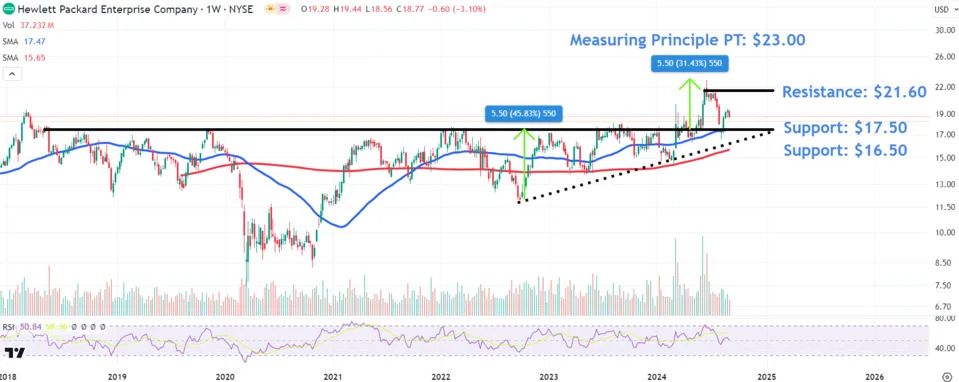
Ascending Triangle Retest
HP Enterprise shares broke out from an
ascending triangle
in June on the largest weekly trading volume since early November 2015, only to retrace the move throughout most of July, However, the stock found buying interest last month on a retest of the pattern’s top trendline and rising
50-day moving average (MA)
, potentially flipping the initial breakout area from prior
resistance into future support
.
Amid the possibility for post-earnings price swings, investors should keep a close eye on the following chart levels.
Lower Price Levels in Play
Firstly, results-driven selling could see another retest of the breakout area around $17.50, where buyers would likely look to place
bids
near the ascending triangle’s top trendline, which also forms part of a multi-year trendline extending back to May 2018.
A failure to hold this level could trigger a decline to the $16.50 level, a location currently just above the upward sloping
200-day MA
where investors may look for buying opportunities near the descending triangle’s lower trendline.
Higher Price Levels to Watch
An initial overhead level to focus on sits around $21.60, where the stock may run into resistance near a range of similar trading levels positioned near its record close in July.
Investors can also forecast a
price target
using the
measuring principle
, sometimes referred to the measuring move technique. To do this, we calculate the distance between the ascending triangle’s two trendline towards the start of the pattern and add that amount to the initial breakout point. In this case, the technique projects an upside target of $23 ($5.50 + $17.50), just above the stock’s
all-time high (ATH)
at $22.82.
The comments, opinions, and analyses expressed on Investopedia are for informational purposes only. Read our
warranty and liability disclaimer
for more info.
As of the date this article was written, the author does not own any of the above securities.
Read the original article on
Investopedia
.
