
Watch These IBM Price Levels as Stock Soars After AI Drives Strong Earnings

Key Takeaways
International Business Machines (
IBM
) shares soared Thursday after the computing giant posted better-than-expected fourth-quarter earnings, boosted by the strength of its AI business.
The company said its generative AI book of business grew by almost $2 billion from the prior quarter, adding that clients globally are turning to
Big Blue
in an effort to enhance their enterprises by using AI. IBM’s software segment
revenue
grew 10.4% from a year earlier to record its biggest jump in five years, helping to offset softness in its consulting and infrastructure businesses.
IBM shares were up 12% at $256 in afternoon trading, after hitting a record near $262 this morning. The stock has gained 36% over the past year, outpacing the S&P 500’s performance over the period.
Below, we break down the
technicals
on IBM’s chart and identify key price levels that investors may be watching out for.
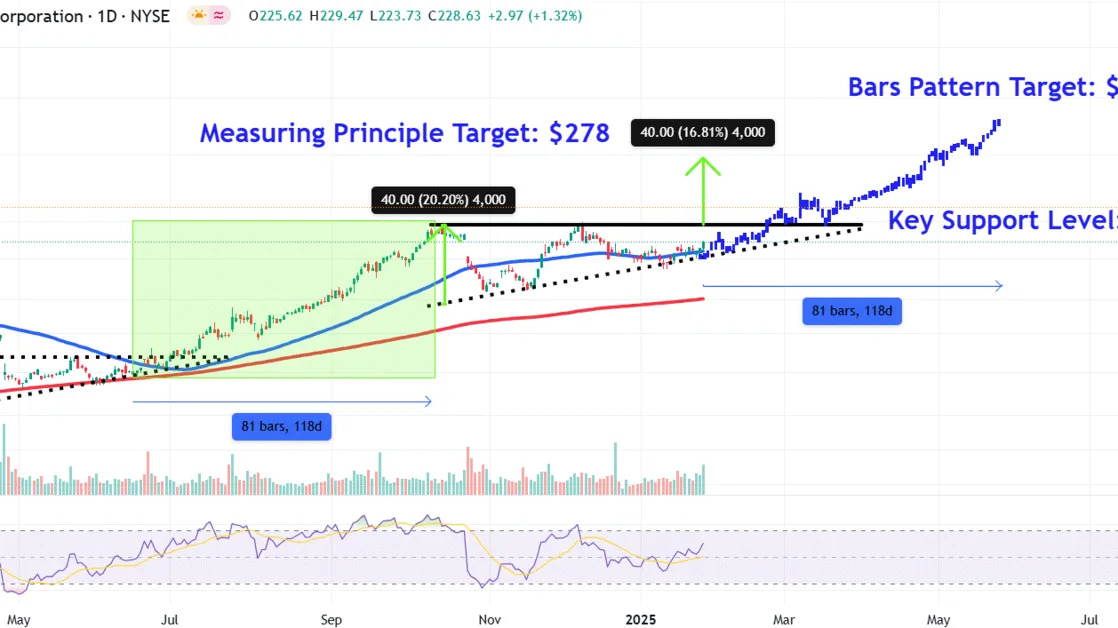
Ascending Triangle Breakout
IBM shares have oscillated within an
ascending triangle
since early October last year, with the price recently finding support from the pattern’s lower trendline leading into the company’s quarterly report.
With the bullish momentum accelerating Thursday, the stage is set for a
breakaway gap
above the triangle’s top trendline.
Let’s apply
technical analysis
to forecast two potential upside
price targets
to watch and also identify a key
support level
worth monitoring during retracements.
Upside Price Targets to Watch
Measuring Principle Target
The
measuring principle
works by analyzing the ascending triangle on IBM’s chart to project an upside target.
To apply the technique, we calculate the depth of the pattern near its widest point and add that amount to the triangle’s top trendline. For instance, we add $40 to $238, which forecasts a target of $278.
Bars Pattern Target
To predict how a longer-term
uptrend
in the stock may play out, investors can use bars pattern analysis, a technique that studies prior trends on the chart to predict future directional price movements.
When applying the tool to IBM’s chart, we extract the stock’s trending move from June to October last year and reposition it from this month’s low. The analysis forecasts an upside target of around $305, while indicating that the trend could last until May if
price action
mimics the earlier trend’s duration.
We selected this bars pattern as it commenced from the lower trendline of a prior ascending triangle, similar to how the current move higher has started.
Key Support Level to Monitor
During
pullbacks
, investors should monitor how the stock’s price responds to the $238 level. This area on the chart would likely attract buying interest on a retest of the ascending triangle’s top trendline, which could flip from a location of prior
resistance
into a region of future support.
The comments, opinions, and analyses expressed on Investopedia are for informational purposes only. Read our
warranty and liability disclaimer
for more info.
As of the date this article was written, the author does not own any of the above securities.
Read the original article on
Investopedia
