
Watch These Intel Stock Price Levels as Chipmaker Continues to Rally

Key Takeaways
Intel (
INTC
) shares rose again Tuesday after surging more than 12% last week as investors bid up the stock
following a strategic update and ongoing deal rumors
.
Last Tuesday, the embattled
chipmaker
said it plans to
spin off
its venture fund as a standalone entity while remaining an investor in an effort to improve efficiency across the business. Later in the week, sentiment received a further boost after a report surfaced that the company might be a
takeover target
.
Intel shares were up 2.5% at around $22 in early-afternoon trading Tuesday. Despite the recent rally, the stock has lost more than half its value over the past 12 months amid investor skepticism about the company’s ability to capture a greater share of the booming
artificial intelligence (AI)
chip market.
Below, we break down the
technicals
on Intel’s
weekly chart
and point out crucial price levels worth watching out for.
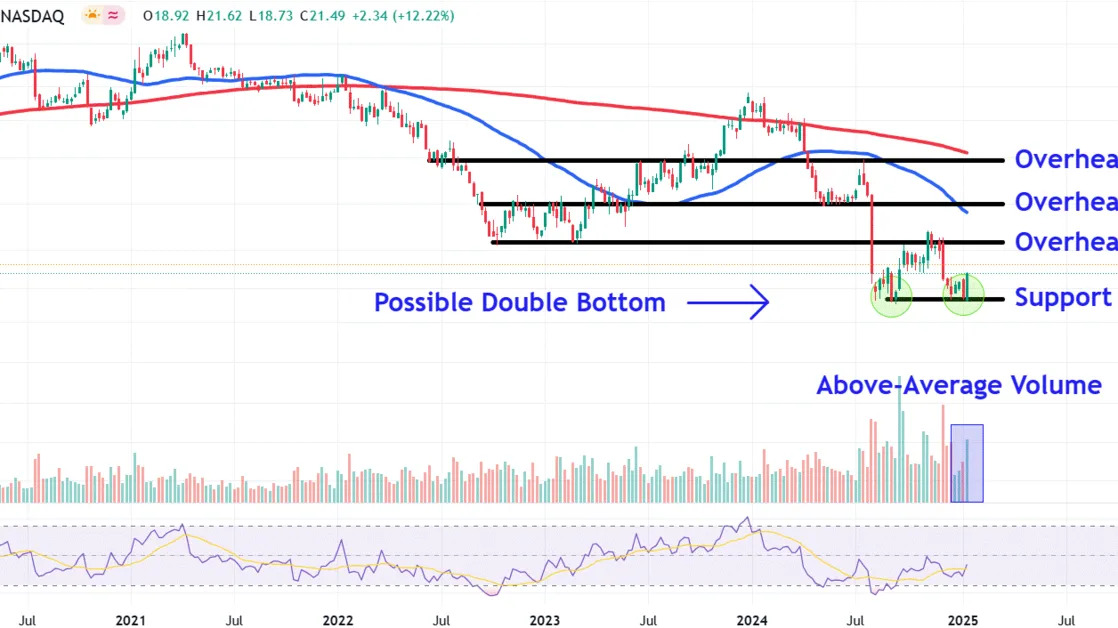
Bullish Engulfing Pattern Points to Possible Double Bottom
Intel shares staged an impressive reversal last week to form a
bullish engulfing pattern
, a two-bar
candlestick
formation that signals a positive shift in investor sentiment. Importantly, the pattern formed around the same location on the chart as the early-September low, setting the stage for a potential
double bottom
.
Furthermore, last week’s rally occurred on the highest weekly
volume
since early December, indicating buying conviction from larger market participants, such as
institutional investors
and hedge funds.
Let’s identify three overhead areas that investors may be watching if the chipmaker’s stock moves higher and also point out a key
support level
to track if the stock gives back last week’s gains.
Crucial Overhead Areas to Follow
Follow-through buying could initially see the shares climb to around $25. This area on the chart may provide
resistance
near the October 2022 and February 2023 troughs, which also closely align with the the November 2024
peak
.
A decisive close above this area may see the shares climb to the $30 mark. Investors could seek
exit points
here near a trendline that connects a range of comparable highs and lows on the chart from September 2022 to June last year. This region also roughly aligns with the
50% Fibonacci retracement level
when stretching a grid from the December 2023 high to September 2024 low.
More bullish
price action
could propel a move up to around $37, a location where the shares may run into selling pressure near the closely watched
200-day moving average
and a
horizontal line
that links a series of comparable trading levels on the chart between June 2022 and July last year.
Key Support Level to Track
Finally, the
bulls
’ failure to defend recent gains could see the shares revisit significant lows around $19. Investors who chase bottoms could look for buying opportunities around the prominent September and January troughs.
The comments, opinions, and analyses expressed on Investopedia are for informational purposes only. Read our
warranty and liability disclaimer
for more info.
As of the date this article was written, the author does not own any of the above securities.
Read the original article on
Investopedia
