
Watch These Intel Stock Price Levels as Deal Speculation Mounts

Key Takeaways
Intel (
INTC
) shares will likely remain on investors’ radar screens Tuesday after
The Wall Street Journal
reported Saturday that Broadcom (
AVGO
) and Taiwan Semiconductor Manufacturing Co. (
TSM
) are
considering bids for parts of the embattled chipmaker
.
According to the report, Broadcom has been looking into Intel’s chip-design and marketing business, while contract chipmaker TSMC has mulled taking over some or all of Intel’s chip plants as part of an investor
consortium
or another structure.
Intel shares
surged more than 20% last week
after Vice President JD Vance said at a recent AI conference in Paris that the Trump administration would take steps to ensure AI chips are designed and manufactured in the U.S, a move that could benefit Intel’s foundry business that makes chips for third parties.
Sentiment surrounding the stock received a further boost last week on
speculation that the company may partner with TSMC to fabricate chips in the U.S
. Despite last week’s gains, Intel shares have lost nearly half their value over the past year amid concerns about the chipmaker’s uncertain turnaround plan and inability to capture more of the lucrative AI silicon market.
Below, we take a closer look at Intel’s chart and apply
technical analysis
to identify key price levels that investors may be watching out for.
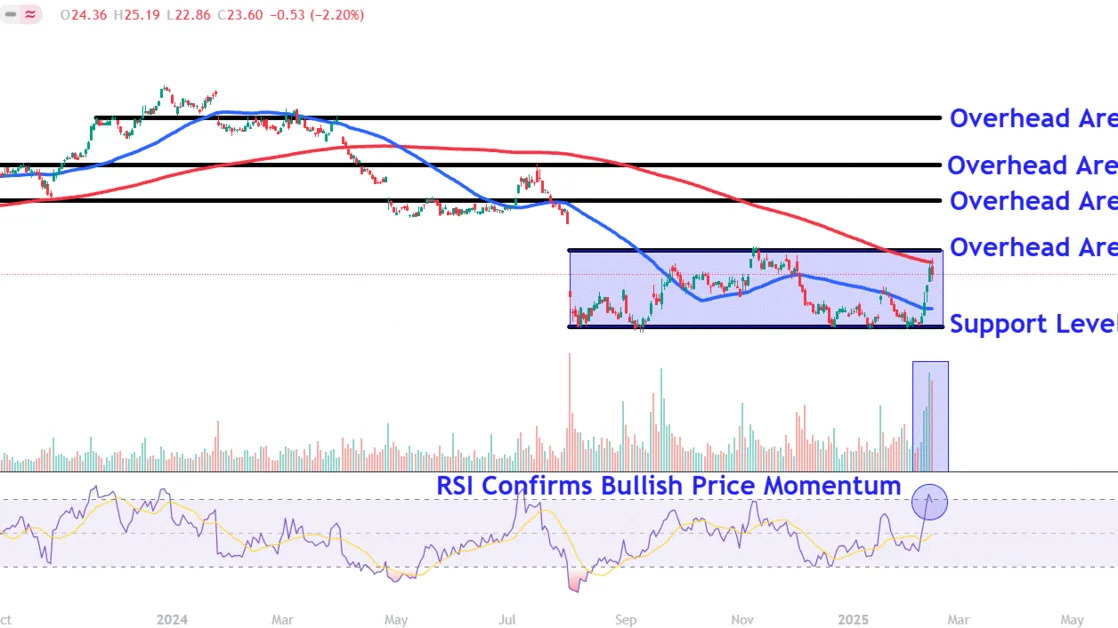
Potential Rectangle Pattern Carving Chart Bottom
Since
gapping
sharply lower in early August last year, Intel shares have remained mostly
rangebound
, potentially carving out a
rectangle
bottoming pattern.
This month, the stock has rallied towards the top of the rangebound period on above-average
volume
, though the closely watched
200-day moving average (MA)
has provided
resistance
in recent trading sessions.
Meanwhile, the
relative strength index (RSI)
sits just below the 70 threshold, confirming bullish momentum, setting the stage for positive
price action
to continue this week.
Let’s identify four key overhead areas on Intel’s chart where the shares could face selling pressure and also point out a major
support level
worth monitoring if the stock reverses course.
Key Overhead Areas to Watch
Firstly, it’s worth keeping track of the $26 area. This location, currenting sitting just above the 200-day MA, may provide overhead resistance near the rectangle pattern’s top trendline.
A decisive
breakout
above this level could see the shares climb to around $32. Investors who have bought shares at lower prices may look for
exit points
in this region near a trendline that connects a range of comparable trading levels on the chart between April 2023 and July last year.
Buying above this level may trigger a move up to the $37 area. The shares could encounter resistance in this location near a
horizontal line
the links multiple peaks on the chart from August 2023 and July last year.
A longer-term
uptrend
opens the door for a move up to around $45, an area where investors may look to
lock in profits
near a range of
peaks and troughs
that formed on the chart between November 2023 and March 2024.
Major Support Level to Monitor
If Intel’s share price reverses, investors should keep a close eye on the $19 level. This area on the chart would likely provide significant support where buyers may seek
entry points
near the rectangle pattern’s lower trendline.
The comments, opinions, and analyses expressed on Investopedia are for informational purposes only. Read our
warranty and liability disclaimer
for more info.
As of the date this article was written, the author does not own any of the above securities.
Read the original article on
Investopedia
