
Watch These Key Tesla Price Levels After The Stock Logs A Five-Day Losing Streak

Key Takeaways
Tesla (
TSLA
) shares may remain in the spotlight on Wednesday after logging their fifth losing trading session in a row yesterday.
Sentiment for the stock may have taken a dent Tuesday after Tesla’s Chinese rival BYD (
BYDDY
) unveiled its
driver assistance system
that it plans to develop with AI startup
DeepSeek
and make available on many models, possibly directly competing with Tesla’s autonomous driving technology in the EV maker’s second largest market.
Others also worry about increasing distractions for Tesla CEO Elon Musk as reports emerged of the
busy billionaire
and a consortium investors filing as unsolicited bid to
take over ChatGPT
maker OpenAI.
Tesla shares saw some gains in early trading Wednesday but have tumbled nearly 20% since the start of the year as of Tuesday’s close amid growing concerns of how the Trump administration’s
proposed tariffs with key trading partners
will effect on the company. However, the stock still remains 30% above its election day close, in part, on expectations that Musk’s close ties with the President will accelerate the car maker’s self-driving ambitions.
Below, we take a closer look at Tesla’s
weekly chart
and use
technical analysis
to identify crucial price levels worth watching.
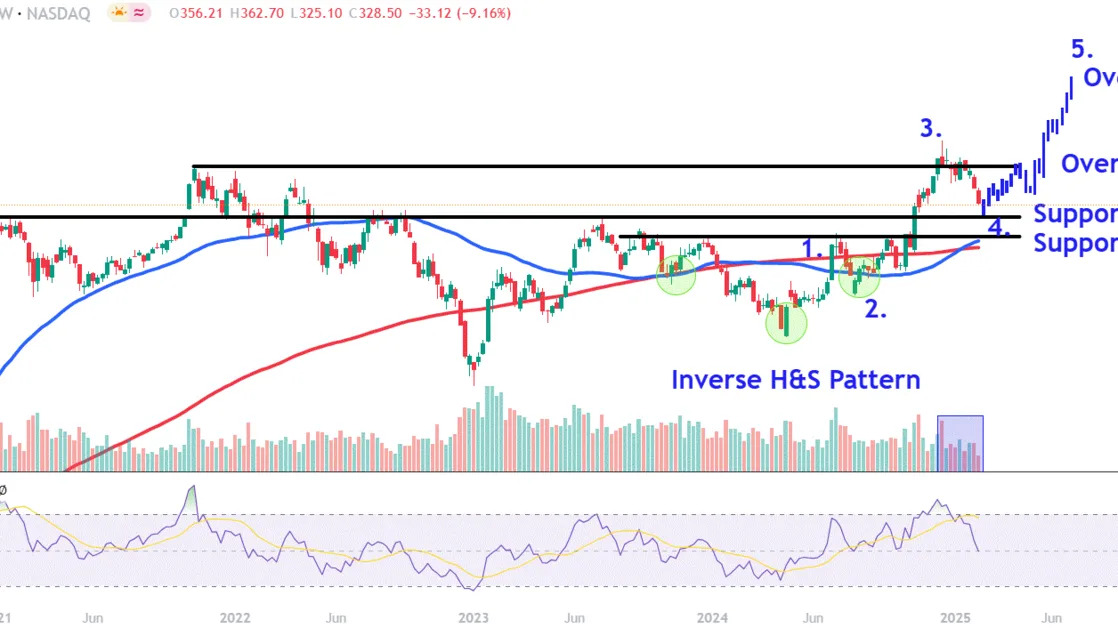
Retracement Accelerates
Since Tesla shares formed a
shooting star
after setting a record high in mid-December, the price has undergone a retracement of more than 20%, albeit on declining
trading volumes
.
In better news for the bulls, a prominent
inverse head and shoulders pattern
on the chart remains intact, while a recent
golden cross
signal also indicates a longer-term positive bias.
Let’s identify two crucial levels where the stock’s current retracement could encounter
support
and also locate several overhead areas to watch upon a resumption of the longer-term
uptrend
.
Crucial Support Levels to Watch
Firstly, it’s worth keeping a close eye on how Tesla shares respond to the
psychological
$300 level. Look for bulls to defend this region that sits near a
horizonal line
linking a range of
peaks
on the chart between January 2021 and July 2023.
Selling below the round number could see the shares revisit the $265 level. This region on the chart may provide support near the inverse head and shoulders’
neckline
, which may flip from an area of prior
resistance
into future support.
Important Overhead Areas to Watch
Upon a resumption of the stock’s longer-term move higher, investors should initially watch the $415 area. Those who bought the recent dip could look to
lock in profits
near the notable November 2021
swing high
, which also closely aligns with several price points situated just below the record high.
Finally, if Tesla shares move into
price discovery
mode, investors can speculate a potential bullish target by applying the bars pattern tool.
When applying the analysis, we take the stock’s
trending
move higher from August to December last year and reposition it from the $300 support level discussed above. This forecasts a target of around $735 and would complete an
Elliot Wave
pattern with five distinct swings.
The comments, opinions, and analyses expressed on Investopedia are for informational purposes only. Read our
warranty and liability disclaimer
for more info.
As of the date this article was written, the author does not own any of the above securities.
Read the original article on
Investopedia
