
Watch These Meta Price Levels After Stock Snaps 20-Day Winning Streak

Key Takeaways
Meta (
META
) shares were slightly lower in premarket trading Wednesday, one day after posting their first decline in more than a month.
The stock fell nearly 3% on Tuesday to snap a 20-session winning streak during which it gained 20.5%. The rally started on Jan. 17 and spanned a period that included the inauguration of President Donald Trump, an
upbeat fourth-quarter earnings report
and the emergence of AI Chinese startup
DeepSeek
.
Meta shares have outpaced their
Magnificent Seven
peers since the start of the year amid optimism that the company’s
significant investments in AI
are helping drive advertising revenue and increasing user engagement.
Below, we break down the
technicals
on Meta’s chart and identify key price levels that investors may be watching.
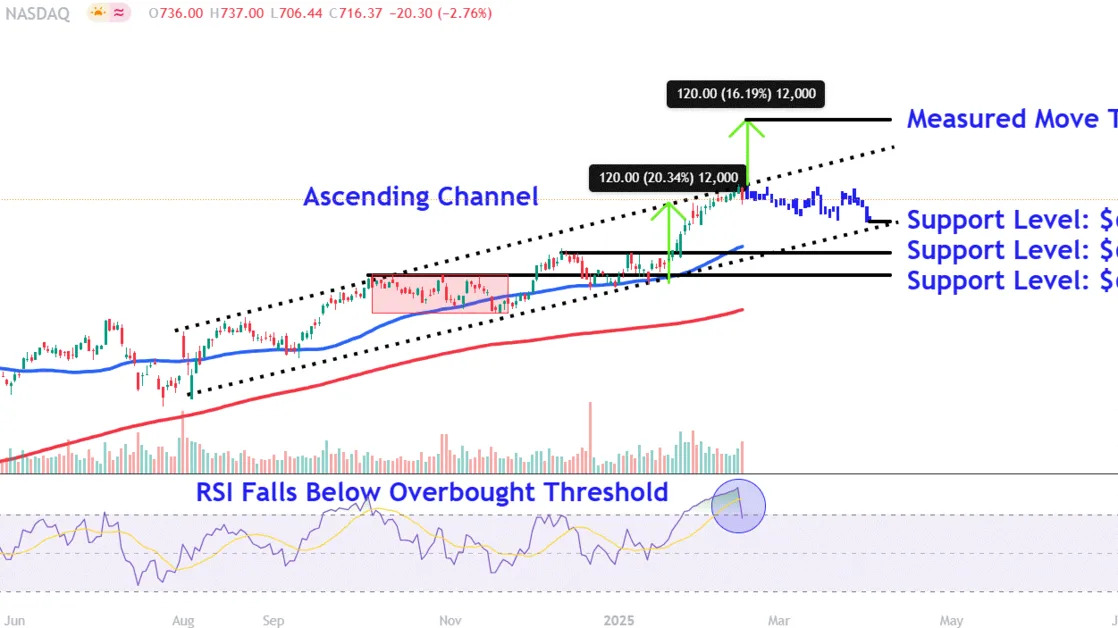
Ascending Channel Remains in Play
Meta shares have trended higher in an orderly
ascending channel
since last July, with
price action
contained between the pattern’s two trendlines.
More recently, the stock has rallied into the channel’s upper trendline, but has failed to make a decisive
breakout
, potentially undermining buying momentum.
In another troubling sign for the bulls, the
relative strength index (RSI)
on Tuesday fell from its highest reading since February last year to below the
overbought
threshold, potentially setting the stage for further declines.
Let’s identify three key
support levels
to watch if the stock undergoes a
consolidation
phase and also project a
price target
worth monitoring if the shares break out above the ascending channel’s upper trendline.
Key Support Levels to Watch
The first lower level in play sits around $680. We projected this price using the bars pattern tool that takes the October to November move lower within the channel and repositions it from yesterday’s high, speculating how a future test of the pattern’s lower trendline may play out.
A
breakdown
below the ascending channel’s lower trendline could see the shares fall to the $632 level, a location on the chart that may provide support near
peaks
in mid-December and early January.
Further selling opens the door for a retest of support around the key $600 level. Investors could look for buying opportunities in this area near the
psychological round number
and a range of similar trading levels on the chart between October and January.
Measured Move Price Target to Monitor
Investors can forecast a price target above the ascending channel’s upper trendline by using the measured move technique, also known by chart watchers as the
measuring principle
.
When applied to Meta’s chart, we calculate the width of the channel in
points
and add that amount to the pattern’s top trendline. For instance, we add $120 to $741, which projects a target of $861, about 20% above Tuesday’s closing price where investors may decide to
lock in profits
.
The comments, opinions, and analyses expressed on Investopedia are for informational purposes only. Read our
warranty and liability disclaimer
for more info.
As of the date this article was written, the author does not own any of the above securities.
Read the original article on
Investopedia
