
Watch These Meta Price Levels as Stock Hits Record Highs on AI Optimism

Key Takeaways
Meta (
META
) shares moved higher Tuesday after setting a record close yesterday, as investors continue to bid up the stock in the aftermath of a solid quarterly earnings report and optimism about the potential for AI-fueled growth.
Last week the Facebook and Instagram parent posted strong fourth quarter results, handily
surpassing Wall Street’s top- and bottom-line estimates
. CEO Mark Zuckerburg lifted sentiment during the
earnings call
when he said that the early success of
DeepSeek’s AI model
had strengthened the company’s conviction in its own open-source AI large language model, Llama.
Meta shares have gained 20% since the start of 2025, making the stock the
top performer
over that stretch among the
Magnificent Seven
group of large-cap tech companies. The stock was up 0.9% at around $704 in recent trading and on pace to close at another record high Tuesday.
Below, we take a closer look at the
technicals
on Meta’s chart and point out crucial price levels worth watching out for.
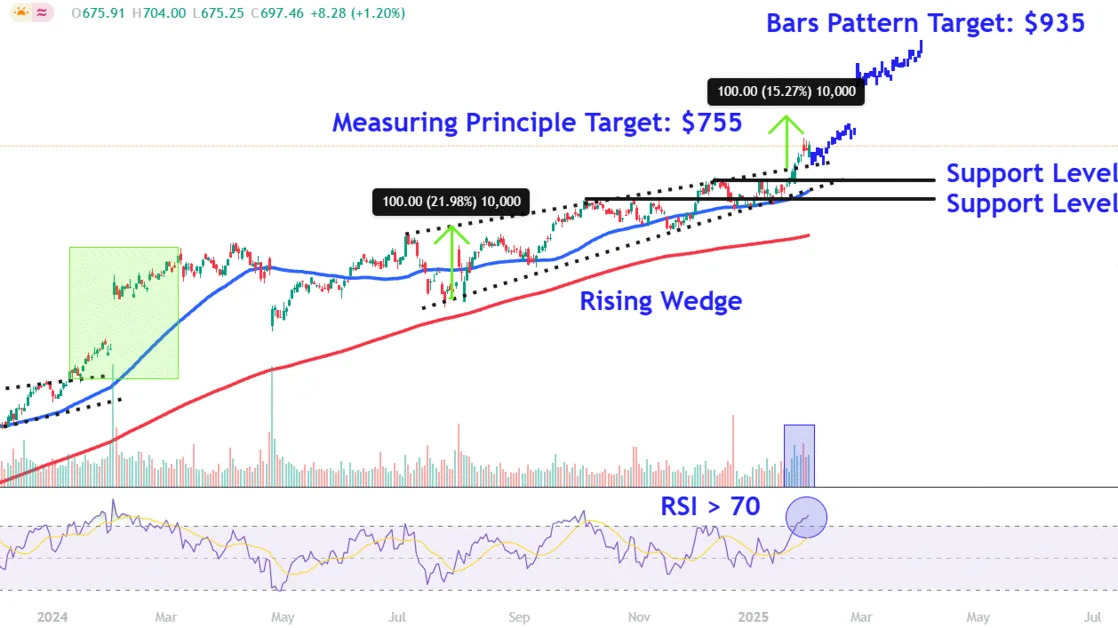
Rising Wedge Breakout
Meta shares trended higher within a six-month
rising wedge
before breaking out above the pattern’s upper trendline last month on above-average
volume
.
Moreover, the
breakout
has coincided with the
relative strength index (RSI)
moving above the 70 threshold, confirming bullish price momentum, but also cautioning
overbought
conditions in the stock.
Let’s apply
technical analysis
to forecast two potential bullish targets and also identify major support levels where the shares may encounter buying interest during
pullbacks
.
Bullish Price Targets to Watch
Measuring Principle
To project a short-term bullish target, investors can use the
measuring principle
, also known by chart watchers as a measured move.
When applying the technique to Meta’s chart, we calculate the distance between the rising wedge’s two trendlines near their widest section and add that amount to the initial breakout point. For instance, we add $100 to $655, which forecasts a target of $755, a location where the shares could see
profit-taking
.
Bars Pattern Analysis
Bars pattern analysis helps investors project a longer-term upside target by studying prior trends to predict how a future directional move may play out.
To apply the tool, we take the stock’s
trending
move from January to March last year and overlay it from last month’s breakout point. This projects a target of around $935, a region on the chart sitting about 33% above current levels where investors may look to
lock in profits
.
We selected this trending period as it immediately followed a breakout from an earlier rising wedge pattern on the chart, potentially setting a playbook for how a similar directional move may play out.
Major Support Levels to Monitor
The first lower level to watch during pullbacks sits around $632. This location on the chart may provide support near the rising wedge pattern’s lower trendline and the early-December and early- January
peaks
.
Finally, selling below this level could see Meta shares revisit lower support around the
psychological
$600 level. Investors may look for buying opportunities in this region near a
horizontal line
that links a range of comparable price points on the chart between October and last month.
The comments, opinions, and analyses expressed on Investopedia are for informational purposes only. Read our
warranty and liability disclaimer
for more info.
As of the date this article was written, the author does not own any of the above securities.
Read the original article on
Investopedia
