
Watch These Moderna Price Levels as Stock Sinks to 5-Year Low

Key Takeaways
Moderna (
MRNA
) shares may remain under the microscope on Tuesday after sinking to a five-year low following
news that the Food and Drug Administration’s top vaccine official, Peter Marks, has resigned
.
Marks, who helped oversee the development of COVID-19 vaccines, said he would leave his role by the end of this week, citing conflicts with Health and Human Services Secretary Robert F. Kennedy Jr. The resignation follows
The Wall Street Journal
reporting Friday that Marks was given a choice to resign or be fired.
Moderna shares have lost nearly a third of their value since the start of the year through Monday’s close and trade 95% below their August 2021 Covid vaccine-driven
record high
. The stock led S&P 500 decliners on Monday, falling 8.9% to $28.35.
Below, we take a closer look at the
technicals
on Moderna’s
weekly chart
and identify key price levels that investors may be eyeing.
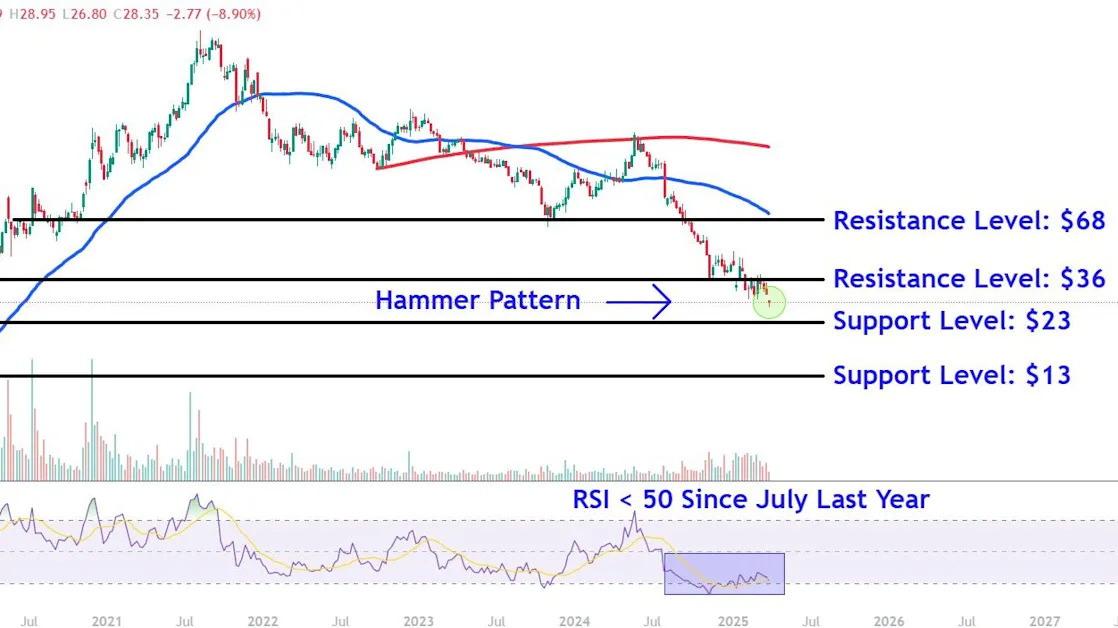
Hammer Candle Emerges
Since an upswing ran into selling pressure at the 200-week moving average last May, Moderna shares have remained in a steep
downtrend
.
It’s also worth pointing out that the
relative strength index (RSI)
has remained below the 50 threshold since July last year, indicating strong downward
momentum
in the stock’s price.
However, in a small win for the bulls, the shares closed well above their session low in Monday’s trading session to form a
hammer
, a bullish
candlestick pattern
with a small body and long wick that signals a shift from selling to buying pressure.
Let’s identify key
support and resistance
levels on Moderna’s chart by applying
technical analysis
.
Key Support Levels to Eye
A close below the hammer pattern could see the shares continue their slide to around $23. Investors may seek buying opportunities in this area near the high of the stock’s first week of trading after
going public
in late 2018, a location that also closely aligns with minor
peaks
on the chart in February 2019 and February 2020.
The
bulls
’ failure to defend this region opens the door for a drop to lower support at the $13 level. The shares could encounter support in this location just above their
record low
near several troughs that formed on the chart between December 2018 and October 2019.
Important Resistance Levels to Watch
An initial recovery effort in the stock could see a retest of overhead resistance around $36. This location on the chart may attract selling pressure near the February
countertrend
high and early-November low, which also aligns with price
spikes
in February and March 2020.
Finally, a more-significant trend
reversal
may see Moderna shares climb to the $68 level. Investors who have
accumulated shares
at lower prices could look for
exit points
in this region near a trendline that connects a range of consolidation in late 2020 with the prominent November 2023 swing low.
The comments, opinions, and analyses expressed on Investopedia are for informational purposes only. Read our
warranty and liability disclaimer
for more info.
As of the date this article was written, the author does not own any of the above securities.
Read the original article on
Investopedia
