
Watch These Netflix Price Levels as Stock Jumps After Strong Earnings

Key Takeaways
Netflix (
NFLX
) shares jumped in extended trading Thursday after the streaming giant
posted first-quarter earnings that topped Wall Street expectations
, boosted by higher subscription prices and ad revenues.
Through Thursday’s close, Netflix shares have gained 9% since the start of the year and trade nearly 60% higher over the past 12 months as the company continues to grow its advertising sales and
live events
content.
Analysts have also touted Netflix’s ability to withstand an economic downturn amid uncertainty related to tariffs, with JPMorgan
describing it as the “most resilient” company
it tracks. Netflix has also
attracted attention
for its attempt to double its revenue and achieve a market capitalization of $1 trillion by 2030, which the
Wall Street Journal
reported earlier this week.
Below, we take a closer look at Netflix’s
weekly chart
and apply
technical analysis
to point out key price levels worth watching.
Momentum Leading into Earnings
After setting their
record high
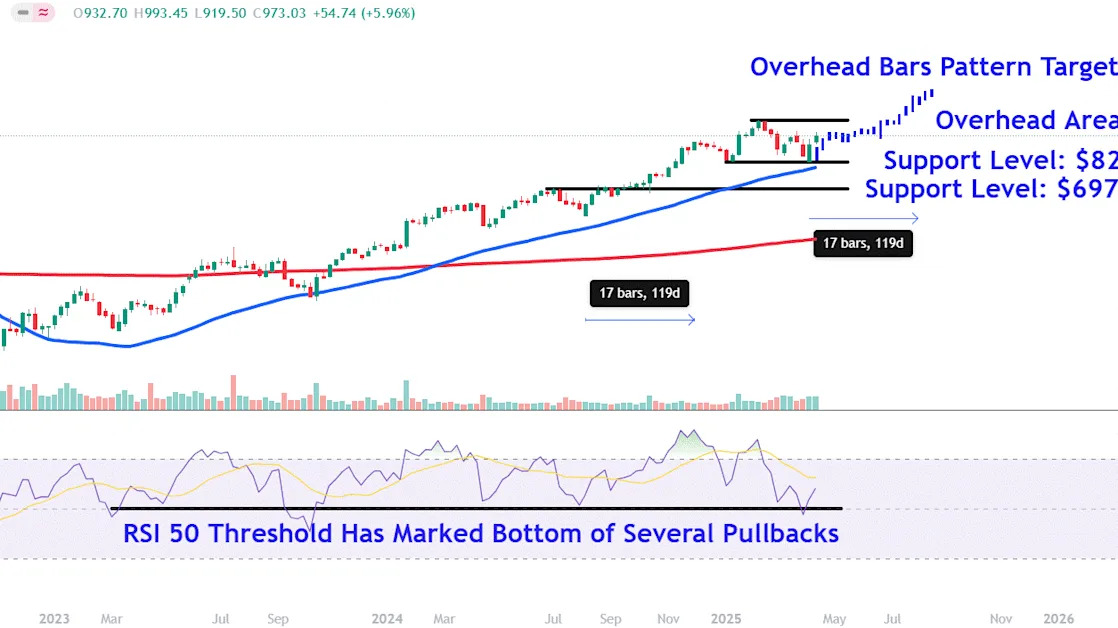
in February, Netflix shares retraced as much as 23% before bulls stepped in to support the stock last week near the 50-week moving average.
It’s worth noting that the rebound coincided with the
relative strength index (RSI)
moving higher from the 50 threshold, a reading that has marked the bottom of several prior
pullbacks
in the stock since early 2023.
More recently, the shares continued to gain momentum leading into the streamer’s quarterly results, with the price set to open around the
psychological $1,000 level
on Monday morning. (U.S. markets are
closed Friday
in commemoration of Good Friday.)
Let’s identify two key overhead areas on Netflix’s chart that investors may be watching and also point out important
support levels
to monitor during retracements.
Key Overhead Areas Worth Watching
Netflix shares rose 3.5% to around $1,007 in after-hours trading Thursday.
The first overhead area to keep tabs on sits at $1,065. Investors who bought shares during the pullback could decide to place sell orders near the stock’s
all-time high (ATH)
.
We can project an
upside
target to watch above the ATH by using bars pattern analysis, a technique that analyzes prior
trends
to forecast future directional movements.
When applying the tool to Netflix’s chart, we take the price bars comprising the stock’s trend higher from August to December last year and overlay them from this month’s low. The analysis forecasts a target of around $1,300, about 34% above Thursday’s closing price.
The earlier trend played out over 17 weeks before the stock
consolidated
, indicating a similar trending move may last until early August if
price action
rhymes.
Important Support Levels to Monitor
During retracements, investors should keep track of the $821 level. A retest of this area could see investors seek
entry points
near last week’s low, which also closely aligns with the end of a five-week losing streak in early January.
Finally, selling below this level sets the stage for a possible fall to around $697. Netflix shares could encounter support in this region near last year’s prominent July
swing high
and a period of
sideways drift
on the chart between mid-August and late September.
The comments, opinions, and analyses expressed on Investopedia are for informational purposes only. Read our
warranty and liability disclaimer
for more info.
As of the date this article was written, the author does not own any of the above securities.
Read the original article on
Investopedia
