
Watch These Netflix Stock Price Levels Ahead of Earnings Report This Week

Key Takeaways
Netflix (
NFLX
) shares moved higher to start the week as the streaming giant gets set to report earnings after Thursday’s close.
Despite concerns that a
tariff-induced recession
could slow advertising spending and see consumers reign in discretionary purchases on services like streaming subscriptions, Wall Street has an average
“buy” rating
on the stock. Analysts at JPMorgan recently pointed out that the company sits positioned to weather an uncertain
macro environment
given its
strong subscriber base
.
As the company moves past reporting subscriber numbers, investors will likely be watching for subscription price hikes to help offset the higher production cost of the streamer’s broadening content slate into areas such as
live sports
and event programming. Netflix shares were up 3% at around $946 in recent trading, pushing the stock’s year-to-date gain to about 6%.
Below, we take a closer look at Netflix’s chart and apply
technical analysis
to identify vital price levels worth watching out for ahead of the streaming giant’s quarterly results.
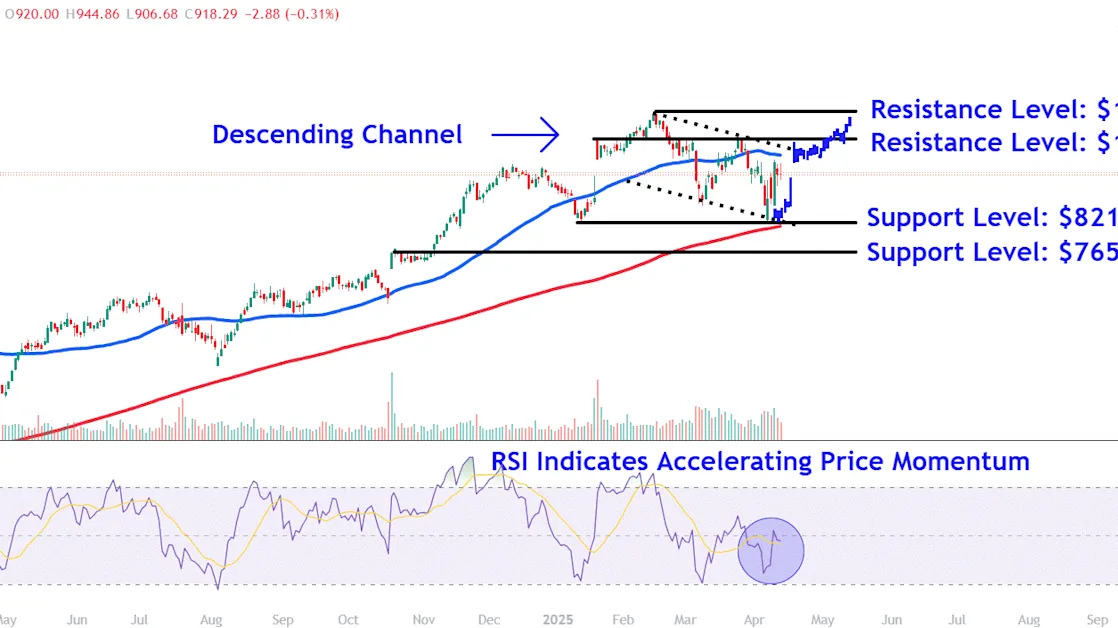
Descending Channel Takes Shape
Since minting their
record high
in mid-February, Netflix shares have trended lower within a
descending channel
.
More recently, the stock found buying interest near the pattern’s lower trendline last week, potentially setting the stage for a post-earnings
continuation
rally.
Meanwhile, last week’s bounce coincided with a strong uptick in the
relative strength index (RSI)
to indicate accelerating momentum before the indicator dipped slightly on Thursday and Friday as the price
consolidated
after Wednesday’s rally.
Let’s identify vital
support and resistance
levels on Netflix’s chart that investors may be monitoring amid the possibility of further price swings this week.
Vital Support Levels to Monitor
Selling from current levels could see a retest of last week’s intraday low around $821. This area on the chart may also provide support near the descending channel’s lower
trendline
and the stock’s January
trough
.
A
breakdown
here could trigger a fall to the next level of vital support at $765. Investors may look to
accumulate shares
in this region near the upper level of a consolidation period that formed on the chart following last October’s
breakaway gap
.
Important Resistance Levels to Watch
Further buying this week could fuel a rally to the $1,000 level. This area would likely attract significant attention near the
psychological round number
and a range of corresponding trading activity on the chart stretching back to mid-October.
Finally, a more bullish move in Netflix shares could see the price climb to $1065, a location on the chart where investors may seek
profit-taking
opportunities near the stock’s record high.
This area also sits in the same neighborhood as a projected bars pattern target that takes the
trend
higher that immediately preceded the descending channel and repositions it from last week’s low, with the analysis speculating how a potential continuation move in the stock may play out.
The comments, opinions, and analyses expressed on Investopedia are for informational purposes only. Read our
warranty and liability disclaimer
for more info.
As of the date this article was written, the author does not own any of the above securities.
Read the original article on
Investopedia
