
Watch These Nvidia Price Levels as Stock Slips Further Into Correction Territory

Key Takeaways
Nvidia (
NVDA
) shares fell for the fourth straight session on Tuesday, extending their slide into a
technical correction
as the stock is down 15% from last month’s record high.
While
analysts remain bullish
on the company’s prospects heading into 2025, investors may be wanting further confirmation that the chipmaker can sell significant volumes of its new Blackwell chips after the reported discovery of
overheating issues
last month prompted concerns over production delays.
Depsite its recent slump, the stock is still up about 160% since the start of the year, far outpacing the S&P 500’s 27% return over the period, amid booming demand for the company’s AI silicon.
The stock fell 1.2% to close Tuesday’s session at $130.39.
Below, we take closer look at the AI chipmaker’s chart and use
technical analysis
to identify important price levels to watch out for.
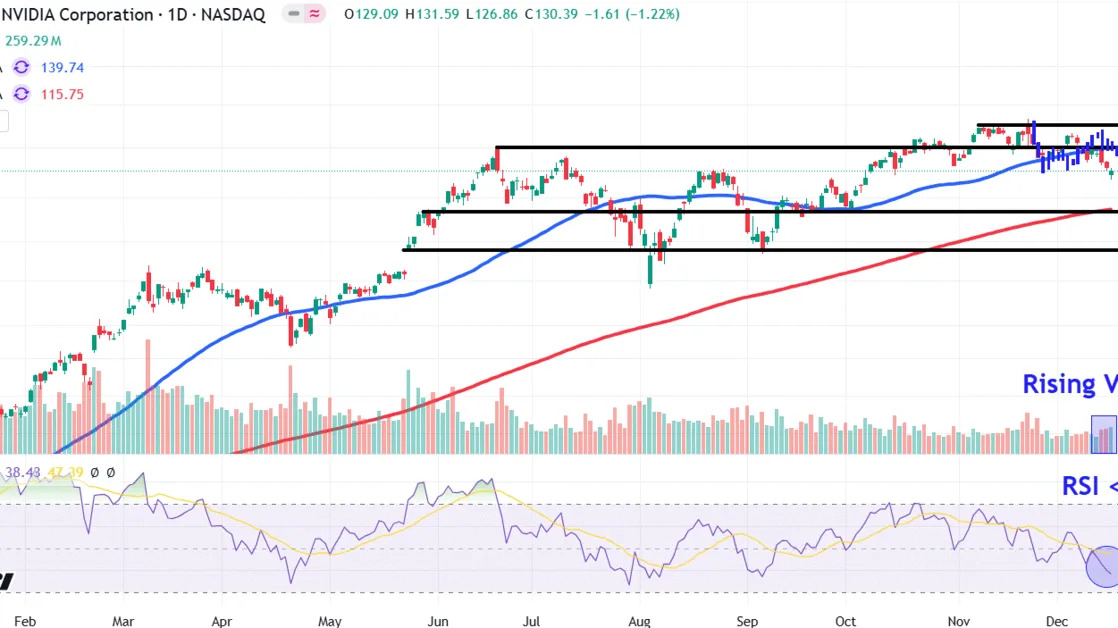
50-Day Moving Average Breakdown
After setting a record high in November, Nvidia shares traded mostly
sideways
before falling below the
50-day moving average (MA)
late last week, potentially setting the stage for further consolidation.
While stock
volume
remains below longer-term averages, it has edged up in recent trading sessions, pointing to an increase in selling activity. Moreover, the
relative strength index (RSI)
has slipped below 50, confirming weakening price momentum.
Let’s turn to Nvidia’s chart to identify several key
support and resistance
levels that investors may be tracking.
Key Support Levels to Watch
Upon further selling, investors should initially keep an eye on the $115 level. Nvidia
bulls
may step up to the plate in this area near the
200-day MA
, which also closely aligns with a range of comparable
price action
on the chart between May and October.
A
breakdown
below this important technical area could see the shares revisit lower support around $102, a location on the chart where investors may seek
entry points
near the low of a late-May
breakaway gap
and prominent
troughs
that formed in August and September.
Interestingly, this region also roughly matches a bars pattern projected target that takes the stock’s June to August correction and overlays it from November’s
all-time high (ATH)
.
Important Resistance Levels to Monitor
If the stock regains its upward momentum, it’s worth monitoring how it responds to the $140 level. The shares may encounter resistance in this area near a
horizontal line
that links the June
swing high
with a series of similar price points between October and December.
Finally, further buying could propel a bullish move to around $150, a region on the chart where investors could decide to
lock in profits
near a cluster of
candlesticks
positioned just below the stock’s record high set late last month.
The comments, opinions, and analyses expressed on Investopedia are for informational purposes only. Read our
warranty and liability disclaimer
for more info.
As of the date this article was written, the author does not own any of the above securities.
Read the original article on
Investopedia
