
Watch These Nvidia Price Levels as Stock Slips on News of Chinese Rival’s AI Chip

Key Takeaways
Nvidia (
NVDA
) shares fell on Monday to snap a four-day winning streak following news that China’s
Huawei Technologies is developing a rival AI chip
.
The Wall Street Journal
reported Monday that the Chinese company hopes the new chip could replace some of Nvidia’s high performance products, adding that it has approached several Chinese tech companies about testing the technical feasibility of the chip.
Nvidia shares are up about 25% from their early-April low but have lost around a fifth of their value since the start of the year as of Monday’s close. In recent months the AI favorite’s stock has come under pressure due to concerns over significantly
cheaper AI technology coming out of China
and a federal
crackdown on the export of the company’s popular H20 chips to China
.
Below, we take a closer look at Nvidia’s chart and apply
technical analysis
to identify key price levels worth watching out for.
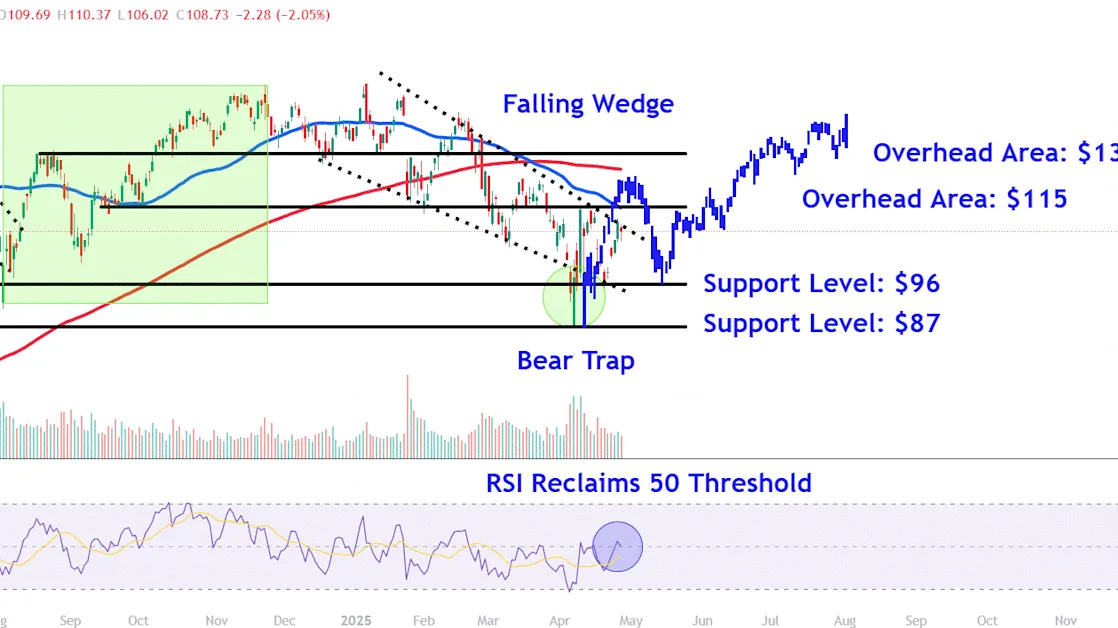
Falling Wedge in Focus
Nvidia shares continue to oscillate within a
falling wedge
after a
bear trap
emerged on the chart earlier this month, a trading event that lures investors to sell upon a breach of major support—the pattern’s lower trendline in this case—before the price makes a sudden move higher.
More recently, the price has pushed up against the pattern’s upper trendline, potentially paving the way for a bullish
breakout
. Meanwhile, the
relative strength index (RSI)
has crossed back above the 50 threshold, indicating improving price momentum.
Let’s identify two key overhead areas on Nvidia’s chart that could come into play and also locate crucial
support levels
worth monitoring.
Key Overhead Areas to Watch
A breakout above the falling wedge pattern’s upper trendline could initially see the shares test the $115 level. This area may provide overhead resistance near the April
swing high
, a location that also aligns with several
retracements
on the chart stretching back to last September.
Buying above this area may trigger a move up to around $130. Investors who have bought shares at lower prices could look for
exit points
in this region near last year’s prominent August
peak
and December trough. Interestingly, this location also sits just below a bars pattern projected
upside
target that takes the stock’s move higher following a prior bear trap on the chart and overlays it from this month’s low.
Crucial Support Levels Worth Monitoring
A move lower could lead to a retest of support at $96. Investors may look for buying opportunities at this level near last week’s
swing low
and two notable peaks that formed on the chart in March last year.
Finally, a decisive
breakdown
below the falling wedge pattern’s lower trendline could see Nvidia shares revisit lower support around $87. This area on the chart may provide support near the bear trap low and lines up with a range of
price action
between March and May last year.
The comments, opinions, and analyses expressed on Investopedia are for informational purposes only. Read our
warranty and liability disclaimer
for more info.
As of the date this article was written, the author does not own any of the above securities.
Read the original article on
Investopedia
