
Watch These Nvidia Stock Price Levels Amid Continued Slump for AI Favorite

Key Takeaways
Nvidia (
NVDA
) shares fell Monday after the Trump administration said over the weekend it would impose tariffs on major trading partners, adding to the stock’s steep losses last week that were fueled by concerns related to Chinese startup DeepSeek’s low-cost AI model.
The tariffs, which impose 25% levies on Mexican and most Canadian imports, and 10% on all goods from China, have prompted concerns of a broader global
trade war
that could see countries introduce
counter measures
on items, including American AI chips.
Nvidia shares were down more than 2% at around $117 in late trading Monday, after falling 16%
last week
following the revelation of
DeepSeek’s success,
which sparked concerns that Big Tech’s investment in the chipmaker’s pricey AI offerings could wane.
Nvidia shares have lost nearly a quarter of their value since hitting a record high in early January but are still up about 80% over the past 12 months.
Below, we zoom out on Nvidia’s
weekly chart
to identify key longer-term price levels worth watching.
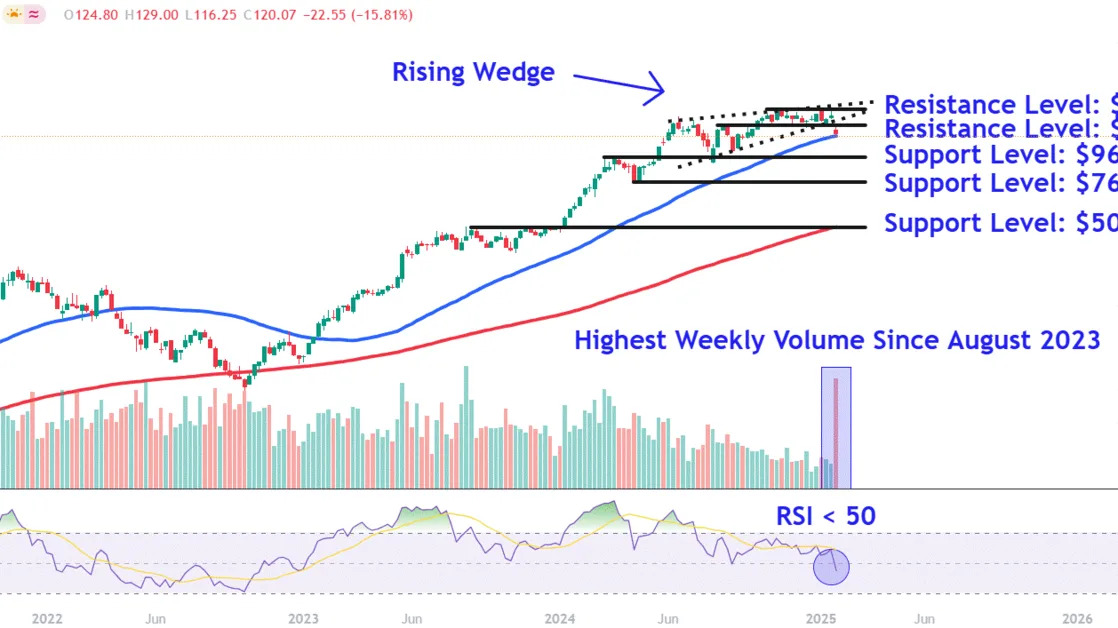
Rising Wedge Breakdown
Nvidia shares broke down below a seven-month
rising wedge
pattern last week on the highest trading volume since August 2023, suggesting
institutional
selling participation.
Moreover, the
relative strength index (RSI)
fell below the 50 threshold to its lowest level since December 2022, confirming increasing selling momentum.
Amid increasing market
volatility
, let’s identify key
support and resistance
levels that investors may be watching.
Key Support Levels to Watch
A
breakdown
below the 50-period MA this week could see Nvidia shares fall to around $96, a location on the chart where they may find support near the March
peak
and August trough.
The next lower support level to watch sits around $76. Buyers may look for
entry points
in this area near the April
pullback
low that formed toward the end of the stock’s strong
trending
period between October 2022 and June last year.
A close below this region opens the door for a more significant
correction
down to the
psychological
$50 level. The shares may attract support in this location near the 200-period MA, which also currently aligns with the stock’s August and November 2023 peaks.
Important Resistance Levels to Monitor
Upon a recovery, investors should initially monitor the $130 level, an area where the stock could encounter selling pressure near the August 2024 peak and December trough.
Finally, follow-through buying could see Nvidia shares revisit the $150 level. Investors who have bought during the recent
selloff
could look to
lock in profits
near a series of price points situated just below the stock’s record high.
The comments, opinions, and analyses expressed on Investopedia are for informational purposes only. Read our
warranty and liability disclaimer
for more info.
As of the date this article was written, the author does not own any of the above securities.
Read the original article on
Investopedia
