
Watch These Oracle Price Levels as Stock Surges on Optimism About AI Joint Venture

Key Takeaways
Oracle (
ORCL
) shares soared Wednesday for the second straight session as investors reacted to news that the enterprise software company will
form a joint venture
with
OpenAI
and Japan’s SoftBank to build
artificial intelligence (AI)
infrastructure.
The initiative, named Stargate, is expected to involve investments of as much as $500 billion over the next four years, as the project aims to bolster American AI leadership and create thousands of U.S. jobs. Reports of the JV surfaced early Tuesday, which gave Oracle a boost yesterday, and were confirmed by President Donald Trump at a White House event last night with executives from the three companies.
Oracle shares were up 7.5% at around $185.50 in afternoon trading Wednesday, adding to yesterday’s 7% gain. The stock has risen nearly 70% over the past year, supported by growing demand for the company’s AI-integrated
cloud
and database offerings.
Below, we break down the
technicals
on Oracle’s chart and identify crucial price levels to watch out for.
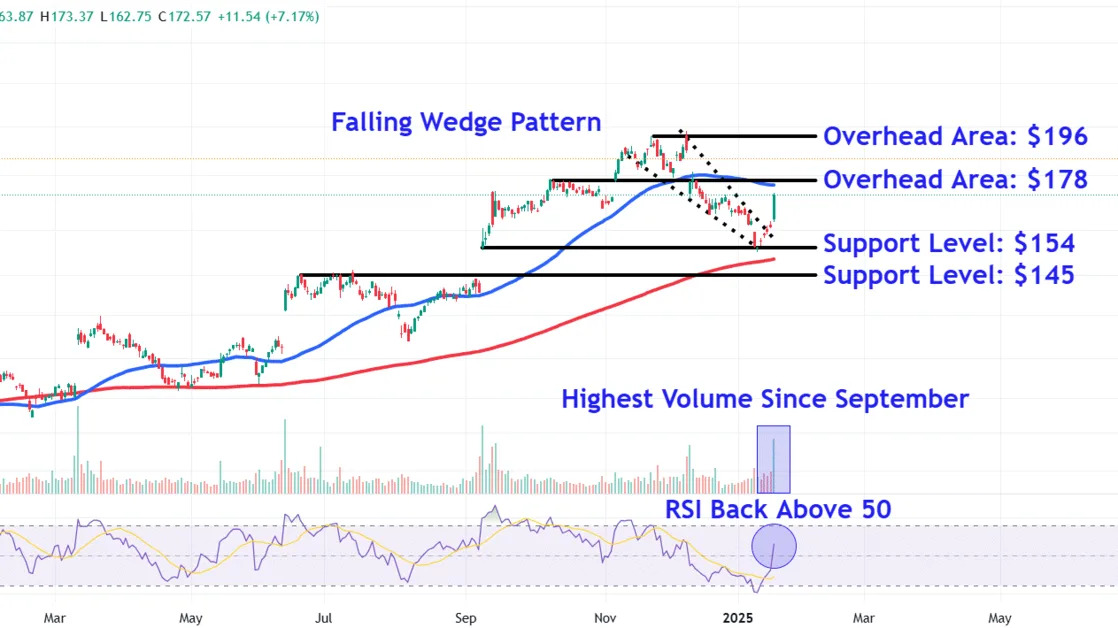
Falling Wedge Breakout
After trending downwards within a
falling wedge
since late November, Oracle shares staged a decisive
breakout
from the pattern on Tuesday.
Impressively, the move occurred on the highest
trading volume
since early September, setting the stage for follow-through buying.
Meanwhile, the
relative strength index (RSI)
has moved back above the 50 threshold to signal improving price momentum, but still remains significantly below
overbought
levels, giving the stock ample room to explore higher prices.
Let’s point out two key overhead areas on Oracle’s chart that may come into focus amid further buying and also identify important
support levels
to monitor during
pullbacks
.
Key Overhead Areas to Watch
The first higher area to watch sits just above the falling
50-day moving average
around $178. Although the stock trades above this level Wednesday, it could provide
resistance
near a trendline that links a range of comparable price points on the chart from October to December.
Further upside could see the shares climb to the $196 area. Investors who have bought at lower prices may look for
exit points
in this location near the stock’s twin
peaks
that formed in late November and early December.
Important Support Levels to Monitor
During declines, investors should initially monitor how the price responds to the $154 level. The shares could encounter support in this area from the January
swing low
, which also closely aligns with the opening price of an early-September
breakaway gap
.
Finally, selling below this level could see the Oracle shares revisit lower support around $145, a location where investors may seek
entry points
near multiple peaks that formed on the chart between June and early September.
The comments, opinions, and analyses expressed on Investopedia are for informational purposes only. Read our
warranty and liability disclaimer
for more info.
As of the date this article was written, the author does not own any of the above securities.
Read the original article on
Investopedia
