
Watch These Palantir Price Levels as Stock Plunges After Earnings Match Expectations

Key Takeaways
Palantir Technologies
(PLTR
) raised its full-year outlook but disappointed investors with
mostly in-line quarterly results
, sending shares in the analytics software provider sharply lower in extended trading on Monday.
The company reported first-quarter revenue of $884 million, up 39% year-over-year and above the analyst consensus. Adjusted earnings per share of 13 cents, rose from 8 cents per share a year earlier, in line with Wall Street’s estimates. Investors may have been looking for more, after the AI darling posted blowout results in
February
and
November
.
Ahead of today’s highly anticipated earnings report, Palantir shares were up 64% since the start of the year and had soared more than five-fold over the past 12 months. The stock has been boosted by optimism that the software maker would benefit from increasing enterprise AI deployments and federal initiatives to improve government efficiency.
The stock fell more than 9% to $112.32 in after-hours trading.
Below, we take a closer look at Palantir’s chart and use
technical analysis
to identify major price levels that investors will likely be watching.
Potential Double Top
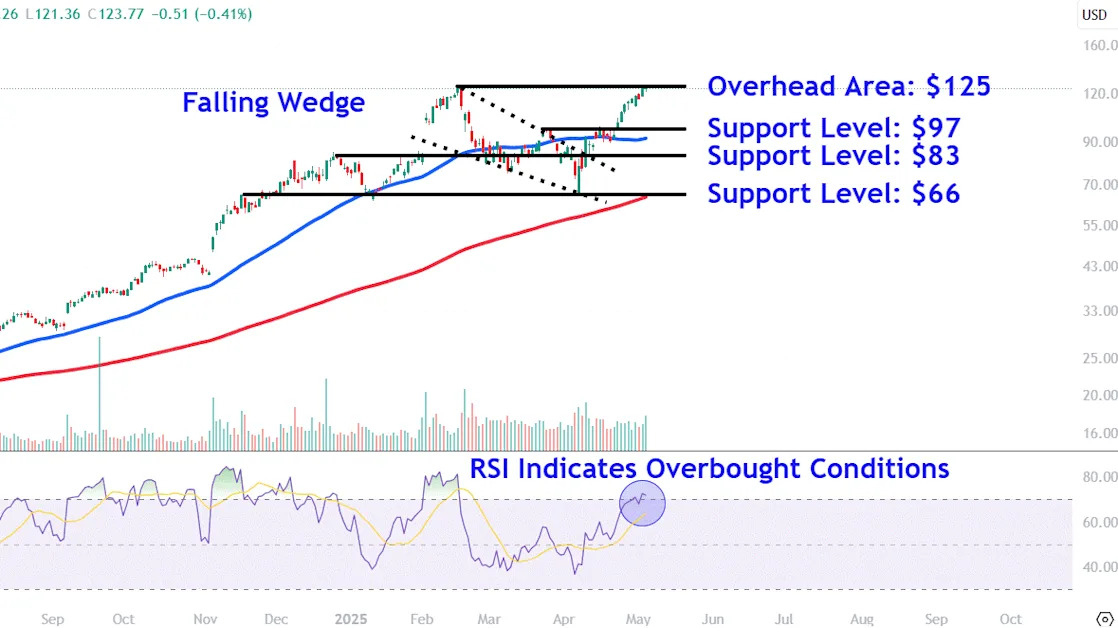
After setting their record high in mid-February, Palantir shares consolidated within a
falling wedge
before breaking out above the pattern last month.
More recently, the stock has rallied to its highest level since mid-February but found significant selling pressure around its record high as the
relative strength index (RSI)
crossed into overbought territory.
Indeed, the stock looks set to continue its retreat from this important
technical
location on Tuesday, possibly forming a
double top
pattern in the process.
Let’s identify three major
support levels
on Palantir’s chart worth watching and also locate a key overhead area to monitor during potential upswings.
Crucial Support Levels Worth Watching
Amid earnings-driven selling, it’s initially worth watching the $97 level. This area on the chart, currently positioned slightly above the
50-day moving average
, could attract buying interest near a brief period of consolidation following the initial
breakout
from the falling wedge pattern and the late-March
countertrend
high.
A decisive close below this level could see the shares fall to around $83. Investors may seek
entry points
at this location near a trendline that connects last year’s prominent December peak and a brief period of
sideways drift
that preceded the stock’s early-February
breakaway gap
.
A more significant
retracement
opens the door for selling down to the $66 level. The shares would likely attract support in this region on the chart near the closely watched
200-day moving average
and last month’s
swing low
, which also closely aligns with the January trough and a minor peak in mid November.
Key Overhead Area to Monitor
Finally, during upswings in Palantir shares, investors should monitor key overhead
resistance
around $125. This level, currently situated just above Monday’s close, will likely attract significant attention near the May high and the prominent February peak, which also marks the stock’s record high.
The comments, opinions, and analyses expressed on Investopedia are for informational purposes only. Read our
warranty and liability disclaimer
for more info.
As of the date this article was written, the author does not own any of the above securities.
Read the original article on
Investopedia
