
Watch These Palantir Stock Price Levels After Recent Sell-Off

Key Takeaways
Palantir Technologies (
PLTR
) shares gained ground on Tuesday as the stock took a breather from a three-week slump that has seen the AI investor favorite lose more than a third of its market value.
The company, a key software contractor to the U.S. Government, has seen its shares come under significant pressure in recent weeks after a report surfaced last month that the
Pentagon plans a reduction in military spending
. More recently, broader selling across tech stocks amid
tariff uncertainty
and talk of a potential recession have dented investor confidence.
Still, some analysts remain bullish on Palantir’s outlook, arguing that the company’s suite of AI-powered analytics software places it in a position to benefit from efforts by the Trump White House to improve government efficiency.
Palantir shares rose 2.2% to close at $78.05 on Tuesday, rebounding from the previous session’s 10% decline. The
stock has fallen
38% since hitting a record high three weeks ago, but the price is still three times what it was a year ago.
Below, we take a closer look at Palantir’s
weekly chart
and use
technical analysis
to identify crucial price levels that investors may be tracking.
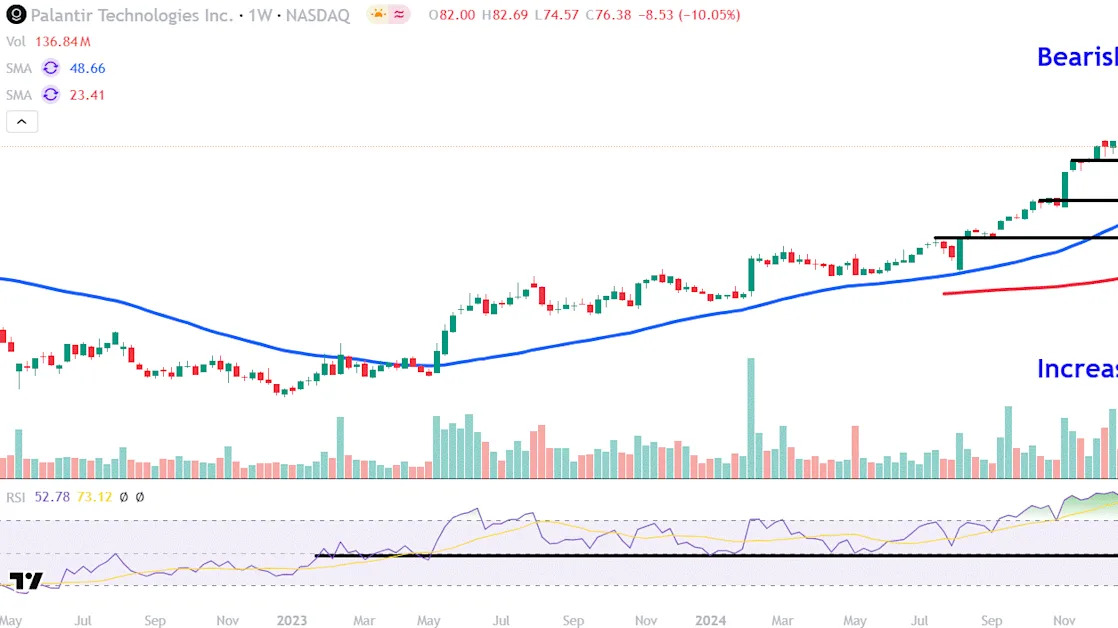
Retreat From Record High
After a
bearish engulfing pattern
signaled a record high in the stock last month, Palantir shares have moved lower on increasing
trading volume
, with bearish
price action
continuing into this week.
Despite the recent decline, the
relative strength index (RSI)
index remains above the key 50 threshold and sits in a location that has generally corresponded with the low of several key
retracements
on the chart dating back to early 2023.
Let’s identity three crucial
support levels
to watch amid the potential for further selling, while also pointing out several important overhead areas to monitor during possible upswings.
Crucial Support Levels to Watch
The first lower support level to watch lies around $66. The shares could encounter buying interest in this area near a period of brief
consolidation
in early November, which also aligns with the mid-January trough.
Further selling may see the shares fall to the $44 level. This location on the chart, currently just below the rising 50-week moving average, could provide support near a range of
sideways drift
that preceded the stock’s post-election surge.
A more significant
correction
in the shares could bring the crucial $30 level into play. Investors may look for
entry points
in this region near last year’s July peak and September
trough
.
Important Overhead Areas to Monitor
During upswings in the stock, investors should initially monitor the $85 level. The shares could run into selling pressure in this area near last week’s closing price, which also corresponds with the stock’s late-December peak.
Finally, a recovery above this level could instigate a
rally
to around $121, a location on the chart where Palantir shares may face
resistance
near the high of the bullish engulfing pattern’s first bar and the
opening price
of its second bar.
The comments, opinions, and analyses expressed on Investopedia are for informational purposes only. Read our
warranty and liability disclaimer
for more info.
As of the date this article was written, the author does not own any of the above securities.
Read the original article on
Investopedia
