
Watch These QQQ Price Levels as Nasdaq 100 Fund Slumps on Tariff Fears

Key Takeaways
The Invesco QQQ Trust (
QQQ
), an
exchange-traded fund (ETF) that tracks the Nasdaq 100 index
, plunged early Thursday after President Trump imposed
sweeping reciprocal tariffs
yesterday. .
The fund’s top three holdings—iPhone maker Apple (
AAPL
), software giant Microsoft (
MSFT
), and AI favorite Nvidia (
NVDA
)—all
suffered steep after-hours losses as the tariffs were announced
. Investors worry the new duties may inflate manufacturing costs and consumer prices, both of which could weigh on corporate profits.
Prior to today’s premarket slide, the QQQ fund had tumbled 7% since the start of the year amid concerns over
tariff uncertainty
, significant AI spending and moderating Big Tech earnings. The QQQ was down more than 4% at around $426 shortly before the opening bell.
Below, we take a closer look at the QQQ fund’s chart and apply
technical analysis
to identify key price levels worth watching out for.
Recent Bullish Momentum Shift in Jeopardy
Since setting its
record high
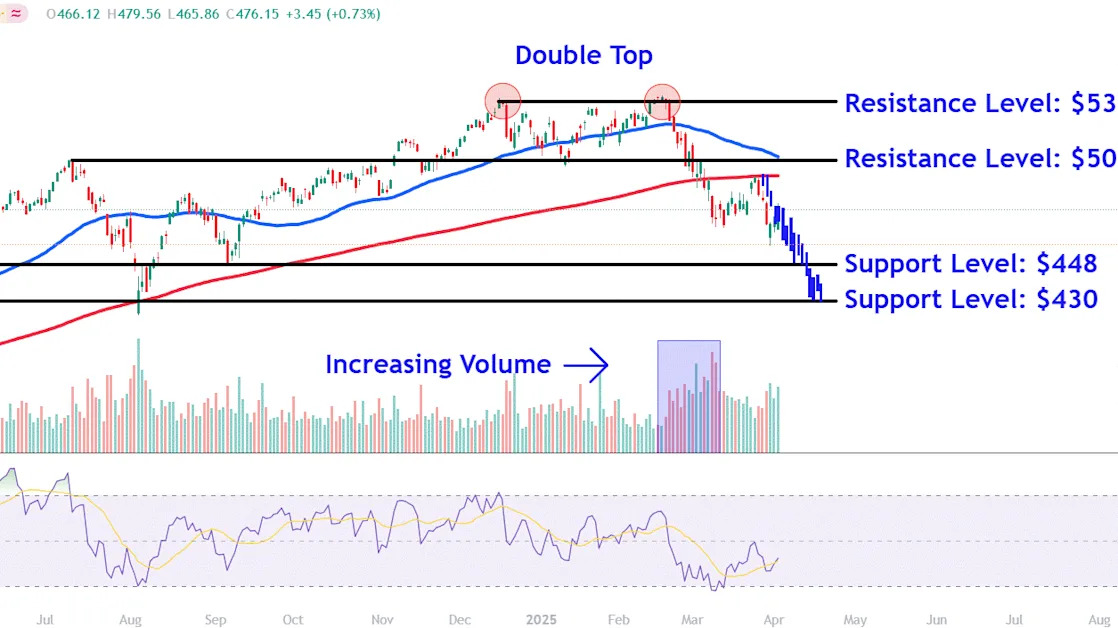
in mid-February, the QQQ fund has trended sharply lower, forming a classic
double top pattern
in the process.
Importantly, increasing
trading volume
has accompanied the move lower, indicating active selling by index-tracking market participants like
institutional investors
and pension funds.
Earlier this week, the fund’s price slumped beneath the mid-March low before staging an intraday
reversal
to close above that closely watched level. However, the recent bullish momentum shift looks in jeopardy.
Let’s analyze the QQQ fund’s chart to identify key
support and resistance
levels that investors may be monitoring.
Key Support Levels to Watch
A decisive close beneath this week’s low could see the fund initially decline to around $448. The area on the chart would likely provide support near last year’s March
peak
, which also closely align with troughs in May and September.
Selling below this level brings key support at $430 into play. Investors who seek
buy-and-hold
positions in the fund could look for
entry points
in this region near a trendline that connects a range of trading levels on the chart between January and August last year.
Interestingly, this location also sits in the neighborhood of a projected bars pattern target that takes the fund’s impulsive move lower from late February to early March and repositions it from the high of the recent upswing high.
Resistance Levels to Monitor
A close above the
200-day moving average (MA)
could see the fund’s price test the $503 level. This location may provide overhead selling pressure near the mid-January trough and last year’s July peak. It’s also worth pointing out that this area roughly sits at the 50%
Fibonacci retracement level
when applying a grid from the February high to March low.
Finally, a resumption of the fund’s longer-term
uptrend
may propel a move to around $537. Investors who have bought at lower levels may decide to
lock in profits
in this area near the December and February peaks that mark the the QQQ ETF’s double top.
The comments, opinions, and analyses expressed on Investopedia are for informational purposes only. Read our
warranty and liability disclaimer
for more info.
As of the date this article was written, the author does not own any of the above securities.
Read the original article on
Investopedia
