
Watch These Starbucks Price Levels as Stock Drops After ‘Disappointing’ Results

Key Takeaways
Starbucks (
SBUX
) shares tumbled on Wednesday after the coffee chain posted
fiscal second-quarter results that fell short of analysts’ expectations
.
The company said that global same store sales fell 1% in the quarter, a bigger drop than Wall Street anticipated. CEO Brian Niccol, who assumed the role last September and has launched a major turnaround effort, characterized the results as “disappointing” in a conference call late Tuesday.
In addition to managing
strategic changes
, the coffee giant faces external challenges such softening consumer spending and a potential rise in the price of coffee beans amid
uncertainty surrounding sweeping tariffs
imposed by the Trump administration.
Starbucks shares were down nearly 7% at around $79 in afternoon trading, after dropping as low as $75.50 early in the session. The stock is down about 13% since the start of the year, and has lost a third of its value since hitting a 52-week high in early March.
Below, we break down the
technicals
on Starbucks’ chart and identify major price levels that investors may be watching.
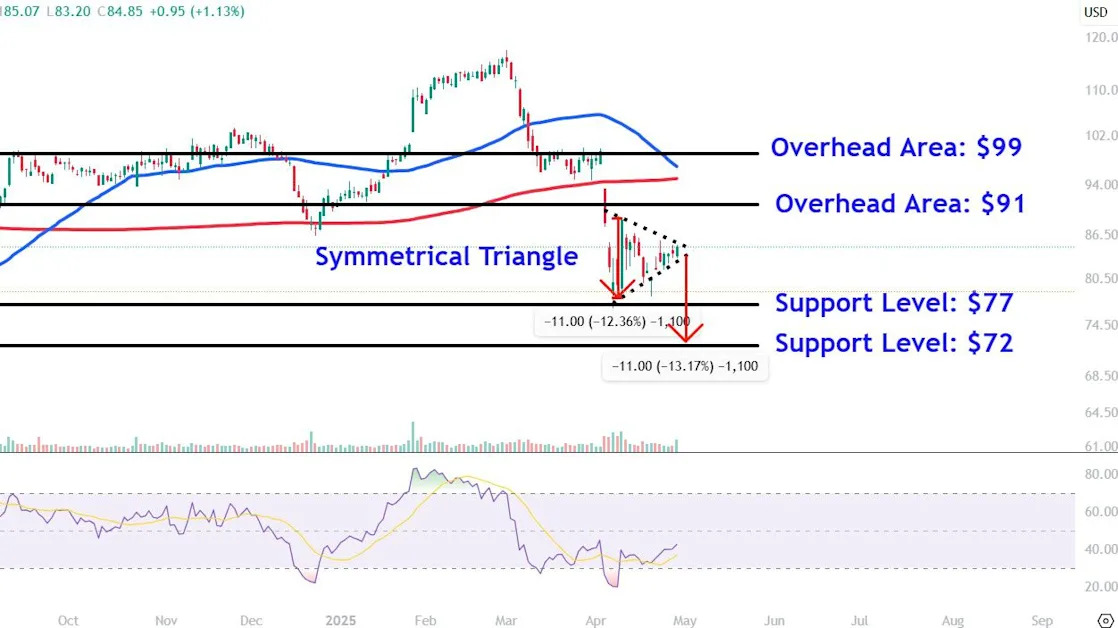
Symmetrical Triangle Breakdown
After falling decisively below the
200-day moving average (MA)
earlier this month, Starbucks shares consolidated within a
symmetrical triangle
to signal indecision among market participants ahead of the company’s quarterly earnings. However, the stock broke down below the pattern’s bottom trendline early Wednesday, setting the stage for a potential
continuation
move lower.
It’s also worth noting that the
50-day MA
has converged toward the 200-day MA throughout April to signal a looming
death cross
—a bearish chart pattern that indicates lower prices ahead.
Let’s identify two major
support levels
where Starbucks shares could attract buying interest and also locate important overhead areas worth monitoring during potential recovery efforts.
Major Support Levels to Watch
The first level to watch sits around $77. Investors may seek
entry points
in this location near the April low, which also closely aligns with a brief consolidation period that preceded a significant
breakaway gap
on the chart last August.
Selling below this level could see Starbucks shares revisit lower support at $72. This area on the chart may attract buying interest near last year’s prominent May and July
swing lows
. The location also sits in the vicinity of a measured move
price target
that calculates the width of the symmetrical triangle and deducts that amount from the pattern’s lower trendline.
Important Overhead Areas Worth Monitoring
During potential recovery efforts, investors should keep a close eye on the $91 area. Tactical traders could place sell orders in this region near the opening price of last August’s breakaway gap which lines up with the low of a
retracement
the following month.
Finally, a more significant bullish
reversal
could see Starbucks shares test resistance at $99. This area may provide overhead selling pressure near a
horizontal line
that links a series of
peaks
on the chart between last August and early April.
The comments, opinions, and analyses expressed on Investopedia are for informational purposes only. Read our
warranty and liability disclaimer
for more info.
As of the date this article was written, the author does not own any of the above securities.
Read the original article on
Investopedia
