
Watch These Supermico Price Levels as Stock Pops After Volatile Year

Key Takeaways
Super Micro Computer (
SMCI
) shares are likely to remain in the spotlight to start the week after jumping more than 10% Friday to snap a five-session losing streak and log their best one-day performance since early December.
Supermicro is looking to move past a volatile 2024 in which accounting and
corporate governance
issues led to several delayed financial reports. However, CEO Charles Liang said last month that postponed filings will be completed by a
Feb. 25 deadline
issued by the Nasdaq, easing concerns about a potential delisting.
Sentiment may have also received a boost after Microsoft (
MSFT
) announced Friday that it
plans to spend about $80 billion
this fiscal year on data centers that power
artificial intelligence (AI)
, a move that could benefit the server maker through increased partnerships and hardware sales.
Supermicro shares ended last year with a 7% gain, but surged more than four-fold between January and March before
slumping as much as 85%
from their record high.
Below, we break down the
technicals
on Supermicro’s chart and identify key price levels worth watching out for.
Stock Reclaims 50-Day Moving Average
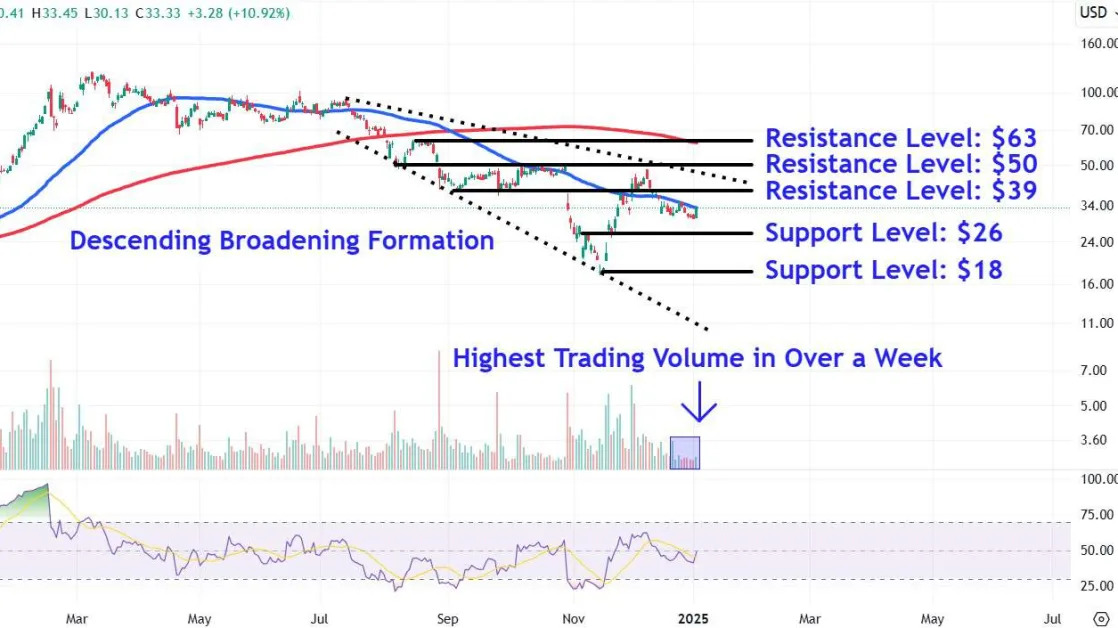
Since mid-July, Supermicro shares have oscillated within an orderly descending
broadening formation
, with the stock tagging both the pattern’s upper and lower trendline on several occasions since that time.
More recently, the price has traded in a narrow range since mid-December but closed above the
50-day moving average (MA)
on Friday on the highest
trading volume
in over a week.
Let’s take a closer look at key
support and resistance
levels on Supermicro’s chart that investors may be eyeing.
Key Support Levels to Monitor
The bulls’ inability to hold the 50-day MA could initially lead to a retest of the $26 level. Investors may look for
entry points
in this location near the high of a brief
countertrend
rally in early November.
A decisive
breakdown
below this level may see Supermicro shares drop to around $18, an area about 46% below Friday’s closing price where they would likely encounter significant support near the prominent November
swing low
.
Crucial Resistance Levels to Watch
Follow-through buying this week could propel a move up to the $39 level, an area currently just below the broadening formation’s upper trendline. The shares may run into selling pressure in this region near two key
troughs
that formed on the chart in September.
Further
upside
could see the shares climb to around $50, where they may encounter resistance near a trendline that connects a range of comparable price points on the chart from the early-August trough to December peak.
Finally, a more bullish move could drive a move to the $63 level. Investors who have purchased the stock at lower prices may look for
profit-taking
opportunities around the August
swing high
, which currently sits in close proximity to the downward sloping
200-day MA
.
The comments, opinions, and analyses expressed on Investopedia are for informational purposes only. Read our
warranty and liability disclaimer
for more info.
As of the date this article was written, the author does not own any of the above securities.
Read the original article on
Investopedia
