
Watch These Supermicro Levels as Stock Soars After Company Meets Nasdaq Filing Deadline

Key Takeaways
Super Micro Computer (
SMCI
) shares soared Wednesday after the server maker
submitted its delayed financial reports
just ahead of a deadline to avoid being delisted by the Nasdaq.
The company said in a statement that the Nasdaq confirmed its compliance with the exchange’s filing requirements, and that “the matter is now closed,”
helping ease investors concerns
in recent days that it might not meet the Feb. 25 cutoff date.
Supermicro shares have
lost more than 40% of their value over the past 12 months
amid accounting and corporate governance allegations that contributed to the company’s delayed regulatory filings. However, the stock has surged 68% since the start of the year, boosted in part by a business update earlier this month that provided an
upbeat revenue outlook
, driven by growing demand for its products to support AI infrastructure.
Below, we break down the
technicals
on Supermicro’s chart and point out key price levels that investors may be eyeing.
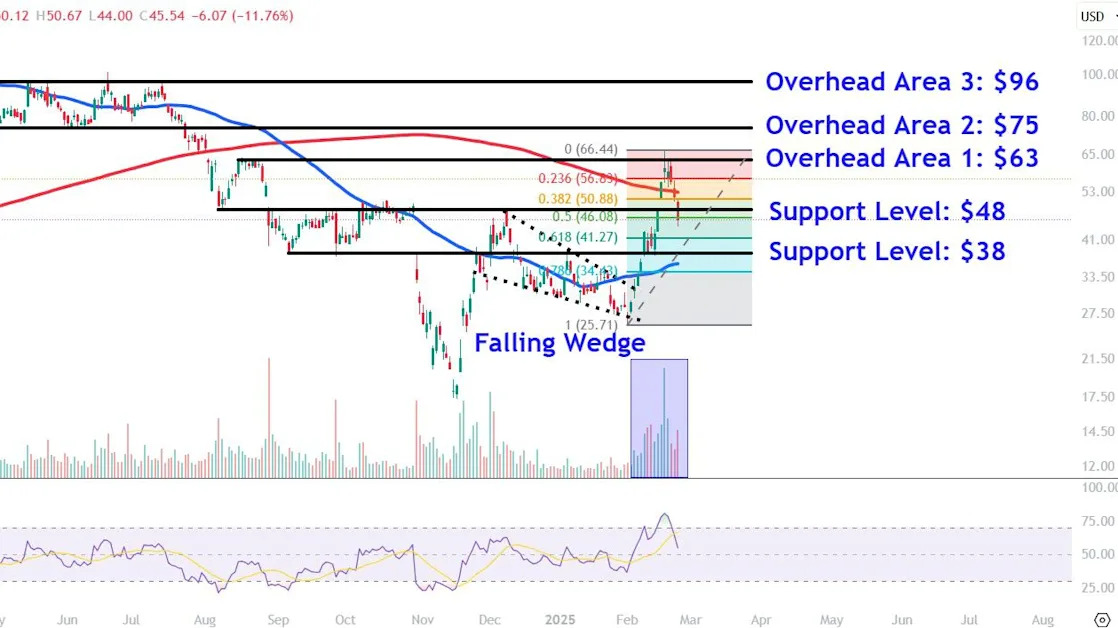
50% Fibonacci Retracement Level Provides Support
Supermicro shares trended sharply higher on increasing
volume
for several weeks after breaking out from a
falling wedge
pattern before running into selling pressure just above the closely watched
200-day moving average
.
While the stock had logged four consecutive down days leading into yesterday’s filing deadline, it found support on Tuesday around the key 50%
Fibonacci retracement level
when applying the tool from this month’s low to high, setting the stage for today’s surge higher.
Let’s identify three key overhead areas on Supermicro’s chart where the shares may encounter
resistance
and also identify major support levels worth watching during potential retracements.
Key Overhead Areas to Monitor
Supermicro shares rose 12% to close Wednesday’s session at around $51. The stock was down 5% in recent after-hours trading.
The first overhead area to monitor sits around $63. The shares may face selling pressure in this region near the August
countertrend
peak, which closely aligns with this month’s high.
A close above this area could see the shares climb to the $75 level. Investors who have
accumulated shares
at lower prices may look to
lock in profits
at this location near a trendline that links the February
pullback
low with a series of troughs that formed on the chart between April and June.
Buying above this level may propel a move to around $96, an area on the chart where the shares could encounter resistance near multiple peaks that developed from February to July just below the stock’s
all-time high
.
Major Support Levels Worth Watching
During retracements, investors should initially watch the $48 area, a region just above the 50% Fibonacci retracement level where the shares may find from a trendline that connects a range of comparable
price action
on the chart from August to December.
Finally, a deeper pullback could see the shares revisit lower support around $38. Investors may seek
entry points
in this location near the prominent September
swing low
, the late October
gap
day’s high, and the January peak.
The comments, opinions, and analyses expressed on Investopedia are for informational purposes only. Read our
warranty and liability disclaimer
for more info.
As of the date this article was written, the author does not own any of the above securities.
Read the original article on
Investopedia
