
Watch These Tesla Price Levels as Stock Plunges to Pre-Election Levels

Key Takeaways
Tesla (
TSLA
) shares tumbled 15% on Monday to lead S&P decliners, closing below their Election Day level for the first time.
Shares in the electric vehicle maker soared after Donald Trump’s victory in the Nov. 5 presidential election amid expectations that CEO Elon Musk’s close relationship with the president would benefit the company. However, since hitting an all-time high on Dec. 18, the stock has plunged 55% amid mounting investor concerns that
Musk’s role as leader of the Department of Government Efficiency
could hurt the Tesla brand and sales. Recent sales numbers from China and Europe have been weak, while uncertainty about the impact of
tariffs
on automakers also weighs on sentiment.
The stock, which has lost ground in
each of the last seven weeks
, fell an additional 3% in extended trading Monday after Musk said in an interview with
Fox Business
that he is running his businesses “with great difficulty.” Nonetheless, Musk added that he expects to remain in the Trump administration for another year.
Below, we break down Tesla’s
weekly chart
and apply
technical analysis
to point out key price levels worth watching out for amid the stock’s heighted volatility.
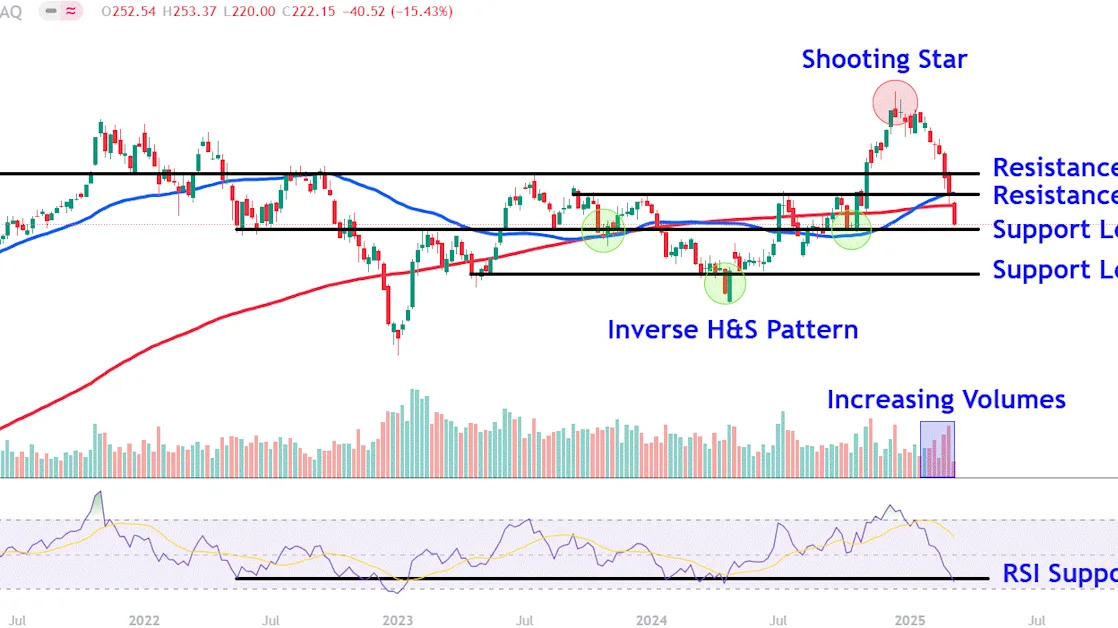
Stock Falls Below 200-Week Moving Average
Since a
shooting star
marked the stock’s record high in mid-December, Tesla shares have trended sharply lower, with the price falling below the closely watched
200-week moving average
in Monday’s trading session.
Moreover, increasing
volumes
have accompanied the recent drop, signaling selling participation by larger market players, such as
institutional investors
and hedge funds.
While the
relative strength index (RSI)
confirms bearish momentum with a reading below 50, the indicator has moved into a region that has typically corresponded with bounces in the stock stretching back to May 2022.
Let’s identify several key
support and resistance
levels on Tesla’s chart that investors may be monitoring.
Key Support Levels to Monitor
Tesla shares fell 15.4% to close Monday’s regular trading session at $220.15.
The first level to track sits around $215. This area, currently near Tuesday’s projected opening price, could find support from a series of lows from May to July 2022 and the “shoulders” of an
inverse head and shoulders
pattern that formed on the chart over a twelve-month period between October 2023 and 2024.
Further
downside
could see the shares tumble to the $165 level. Investors may seek buying opportunities in this region near the April 2023
pullback
low, which also closely aligns with an array of prices positioned just above the bottom of the inverse head and shoulders pattern.
Major Resistance Levels to Watch
During recovery efforts in the stock, it’s worth watching how the price responds to the $265 level, a location on the chart that may provide overhead resistance near the inverse head and shoulders’
neckline
.
Finally, a convincing close above this level could see Tesla shares revisit the
psychological
$300 area. Investors who have bought recent weakness may look to
lock in profits
near a range of prominent
peaks
that developed on the chart between January 2021 and July 2023.
The comments, opinions, and analyses expressed on Investopedia are for informational purposes only. Read our
warranty and liability disclaimer
for more info.
As of the date this article was written, the author does not own any of the above securities.
Read the original article on
Investopedia
