

Watch These Tesla Price Levels as Stock Tries to Jumpstart Rally
Shares Gained More Than 4% on Wednesday
Key Takeaways
Tesla (
TSLA
) shares jumped more than 4% on Wednesday, bucking a broader downturn for large-cap technology stocks.
Although Tesla shares have gained around 25% over the past three months, they have remained in a holding pattern since late July as investors wait for further updates about the company’s vehicle deliveries, its eagerly-anticipated
robotaxi
event, and third-quarter earnings, all of which are expected next month.
Below, we take a closer look at Tesla’s chart and use
technical analysis
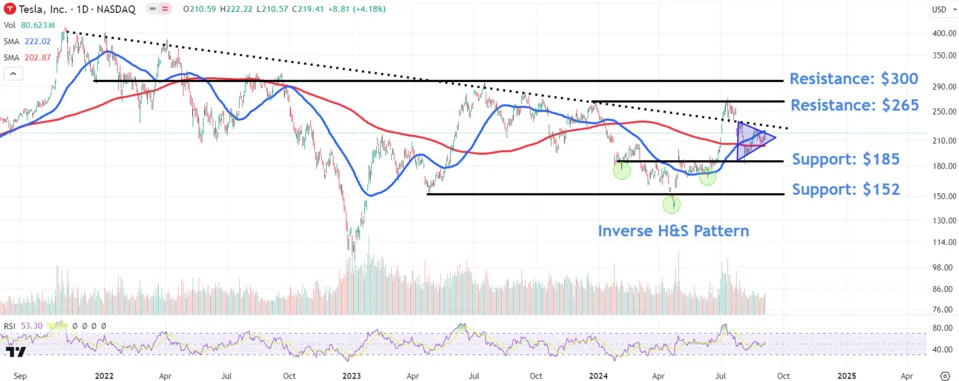
to identify important price levels to watch out for on the road ahead. Telsa shares rose 4.2% Wednesday to close at $219.41.
Symmetrical Triangle Takes Shape
After breaking out above a multi-month
downtrend
line in early July, Tesla shares consolidated for several weeks before reversing back below the indicator. More recently, the EV maker’s stock has traded within a
symmetrical triangle
, indicating a pause in
price action
before potentially making another trending move.
Upon a decisive
breakout
or
breakdown
from the pattern, investors should monitor several key chart levels likely to attract attention.
Breakout Price Levels to Watch
A
volume
-backed breakout above the triangle and multi-month downtrend line could see the shares rally up to the $265 area, where they would likely meet overhead
resistance
from the December and July
swing highs
.
Further buying could drive a move up to around $300. This area on the chart would likely encounter significant resistance from a
horizontal line
connecting multiple
peaks and troughs
from December 2021 to July last year.
Breakdown Levels to Monitor
A breakdown below the symmetrical triangle could see an initial fall to the $185 level, an area likely to encounter buying support near the
neckline
of an
inverse head and shoulders
pattern that formed on the chart between February and June.
Ongoing weakness in the stock may spark a decline down to the $152 region, an area on the chart where bargain hunters may look for buying opportunities near the April 2023
swing low
, which also coincidentally sits just above the April 2024 swing low.
The comments, opinions, and analyses expressed on Investopedia are for informational purposes only. Read our
warranty and liability disclaimer
for more info.
As of the date this article was written, the author does not own any of the above securities.
Read the original article on
Investopedia
.
