
Watch These Ulta Price Levels After News of Buffett Stake Sends Stock Soaring
Shares Jumped 14% in Extended Trading

Key Takeaways
Ulta Beauty (
ULTA
) shares surged nearly 14% in extended trading on Wednesday after
a regulatory filing revealed
that Warren Buffett’s Berkshire Hathaway (
BRK.A
,
BRK.B
) had taken a stake in the cosmetics retailer during the second quarter.
According to a
13-F filing
made available after the close of trading Wednesday, the
Omaha-based conglomerate
purchased 690,106 shares of Ulta Beauty, with the size of the holding valued around $266.3 million as of June 30.
Berkshire’s investment comes as welcome news for shareholders in the specialty chain, whose share price, as of the close of trading Wednesday, has fallen 42% since the stock recorded its
record high
in March. In May, the company lowered its full-year fiscal 2024 outlook amid moderating demand.
Ulta beauty shares rose 14% to $375.50 in after-hours trading.
Below, we take a closer look at the
technicals
on Ulta Beauty’s chart and point out key price levels to watch out for.
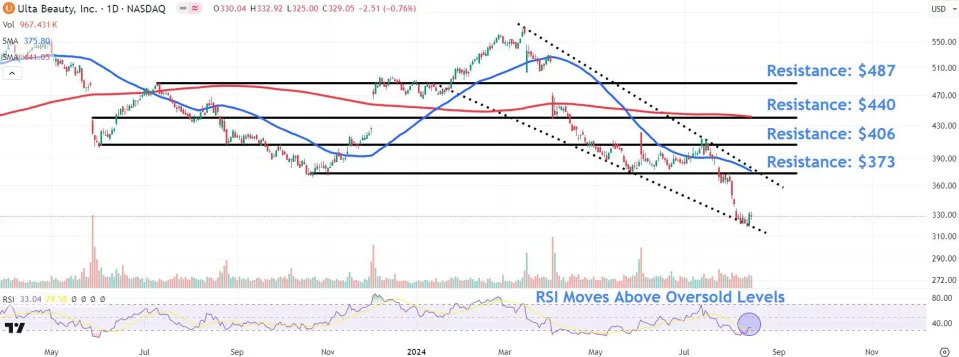
Falling Wedge in Focus
Since recording their record high in mid-March, Ulta Beauty shares have traded within a
falling wedge
, a chart formation that, while sloping downwards, indicates a bullish trend reversal.
Prior to Wednesday’s post-market pop, buyers had defended the pattern’s lower trendline, enough to lift the
relative strength index (RSI)
indicator out of oversold territory.
Levels to Monitor Amid Berkshire-Inspired Jump
Amid Thursday’s expected Berkshire-inspired jump in Ulta Beauty shares, investors should monitor four key price levels.
The first sits around $373, an area on the chart where the price runs into a
confluence
of
resistance
from the October and May
swing lows
, the falling wedge’s top trendline and the downward sloping 50-day moving average (MA).
A close above this level could see the shares climb to $406, where they may encounter selling pressure from a
horizontal line
connecting the June 2023 swing low with multiple
peaks and troughs
from August last year to July this year.
Further buying may drive a rally to the $440 region, currently sitting just below the closely watched 200-day MA. This area would likely find resistance near a multi-month trendline linking the May 26, 2023
gap
high, the August 2023 swing low, and the April 3, 2024 gap low.
Finally, a longer-term uptrend could test higher resistance near $487, where sellers may decide to
lock in profits
around the July 2023
swing high
, which also roughly aligns with a period of
consolidation
from December to January that followed a stock gap.
The comments, opinions, and analyses expressed on Investopedia are for informational purposes only. Read our
warranty and liability disclaimer
for more info.
As of the date this article was written, the author does not own any of the above securities.
Read the original article on
Investopedia
.
