
Watch These Workday Price Levels as Stock Tumbles on Disappointing Outlook

Key Takeaways
Workday (
WDAY
) posted better-than-expected third-quarter results, but provided a current-quarter subscription revenue outlook below Wall Street expectations, sending shares in the human resources and finance software maker tumbling in early trading on Wednesday.
In a post earnings call,
chief finance officer
Zane Rowe told analysts that the company continues to face more deal scrutiny than usual in some parts of the world. However, the company sees opportunities in the
public sector
as government agencies focus on driving
economies of scale
and improving efficiency.
The stock was down 10% at around $243 in the opening minutes of Wednesday’s trading session, pushing the year-to-date decline to 12%.
Below, we take a closer look at Workday’s chart and use
technical analysis
to identify important price levels that investors may be watching.
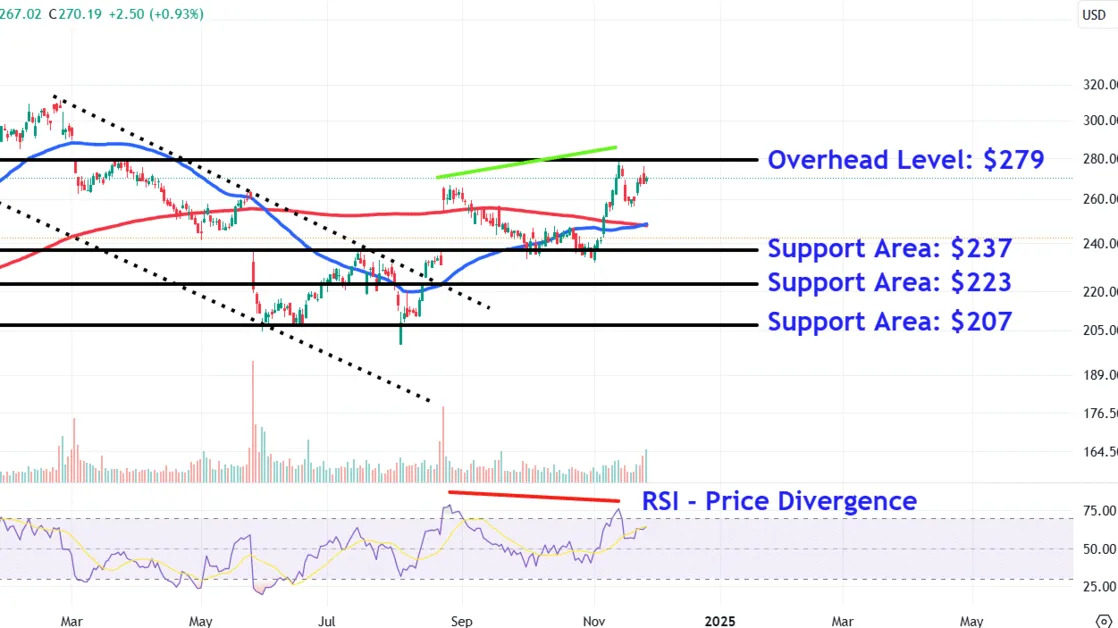
Bearish Divergence
Since breaking out above a
descending channel
, Workday shares have formed two
peaks
on the chart between August and November.
It’s worth pointing out that as the second peak made a higher high, the
relative strength index (RSI)
made a shallower high to create a bearish
divergence
, a technical occurrence that signals weakening buying momentum.
Let’s analyze Workday’s chart to locate several important areas that may provide
support
amid earnings-driven selling and also discuss a key overhead level to watch if the stock makes a recovery.
Important Support Areas to Monitor
Firstly, investors should monitor the $237 area. This region could find support from a multi-month
trendline
that connects a range of comparable trading levels on the chart from July 2023 to October this year.
The bulls’ failure to defend this important technical level could see a fall to around $223, an area where the shares may attract buying interest near similar price points positioned roughly midway between the early September 2023
swing high
and late October 2023
swing low
.
A more significant drop opens the door for a retest of lower support near $207. Investors could look for long-term buying opportunities in this area close to a
horizontal line
that links prominent troughs on the chart from October 2023 to June this year with the early August
bear trap
closing price.
Key Overhead Level to Watch
Amid a recovery in the stock’s price, investors should watch the $279 level. Those who have purchased shares below the
200-day moving average (MA)
may look for
exit points
near the recent November peak, which also closely aligns with the December high and March
countertrend
top.
The comments, opinions, and analyses expressed on Investopedia are for informational purposes only. Read our
warranty and liability disclaimer
for more info.
As of the date this article was written, the author does not own any of the above securities.
